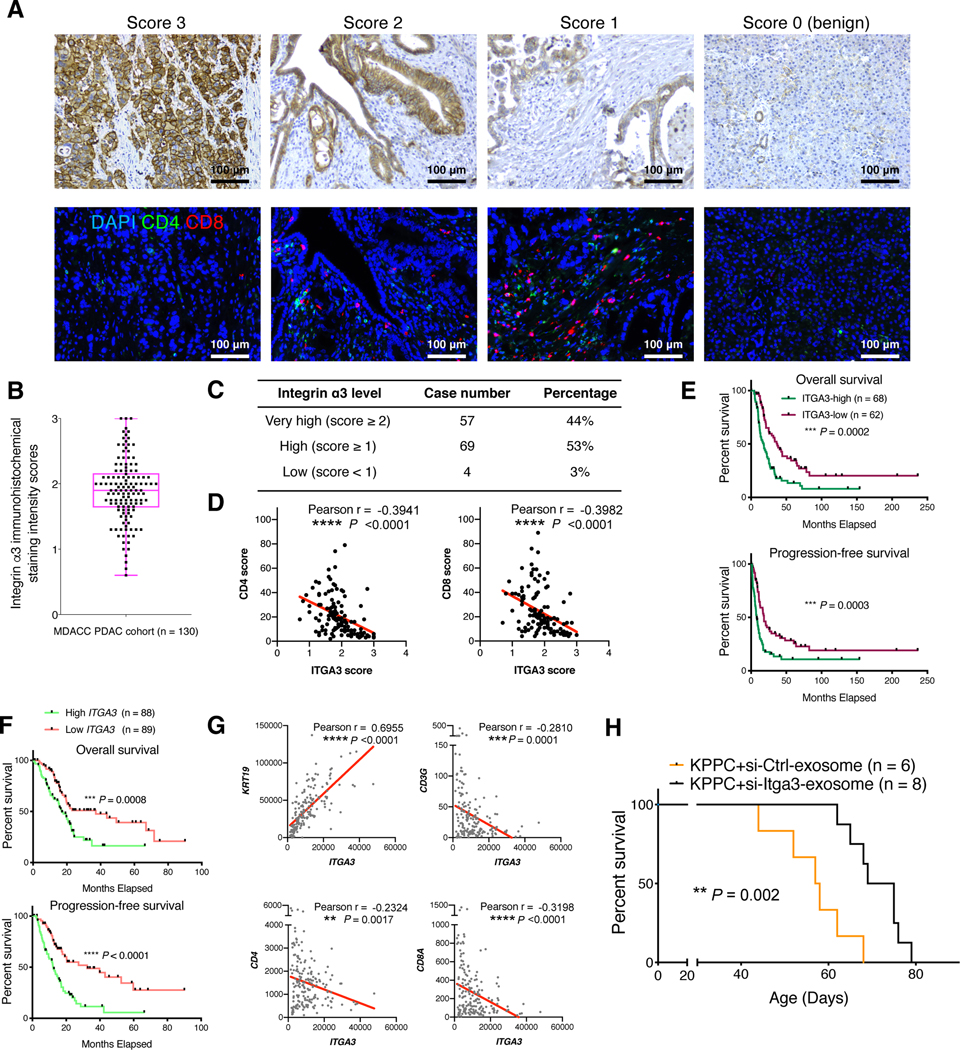
Figure 6. Integrin α3 correlates with poor prognosis and T cell suppression in pancreatic cancer patients.
(A-E) Representative images showing the immunohistochemical (IHC) scores of integrin α3 (A) on a scale of 0–3 in human PDAC tissue microarray sections. CD4 and CD8 staining was also conducted on the serial sections of the same samples (A). The average score of integrin α3 expression was 1.86 for the entire cohort (B). The top and bottom lines of the boxplot represent the interquartile range (IQR); center line represents median; and the whiskers represent minimum and maximum values. Case number and percentage of PDAC samples with indicated integrin α3 expression scores was counted (C). Scatterplot illustrating the reverse correlation between integrin α3 IHC score and CD4/CD8 score was shown in (D). Pearson’s correlation test was used. Kaplan-Meier survival curves showed the correlation between integrin α3 expression level and survival (E). Log-rank (Mantel-Cox) test was used. Scale bar: 100 μm.
(F and G) Survival (F) of pancreatic adenocarcinoma patients from TCGA dataset correlated with ITGA3 expression level. Log-rank (Mantel-Cox) test was used. Patients with available survival data and RNA-seq data (n = 177) were stratified into two groups based on the median ITGA3 expression level. Scatterplot illustrating the correlation between the gene expression levels of ITGA3 and KRT19 (or T cell related genes) in PDAC patients was shown in (G). Pearson’s correlation test was used.
(H) Survival of KPPC mice treated with mesenchymal stem cell-derived exosomes electroporated with either scrambled siRNA-control or siRNA-Itga3. Log-rank (Mantel-Cox) test was used.
**p < 0.01, ***p < 0.001, ****p < 0.0001; NS: not significant.
See also Figure S5.

