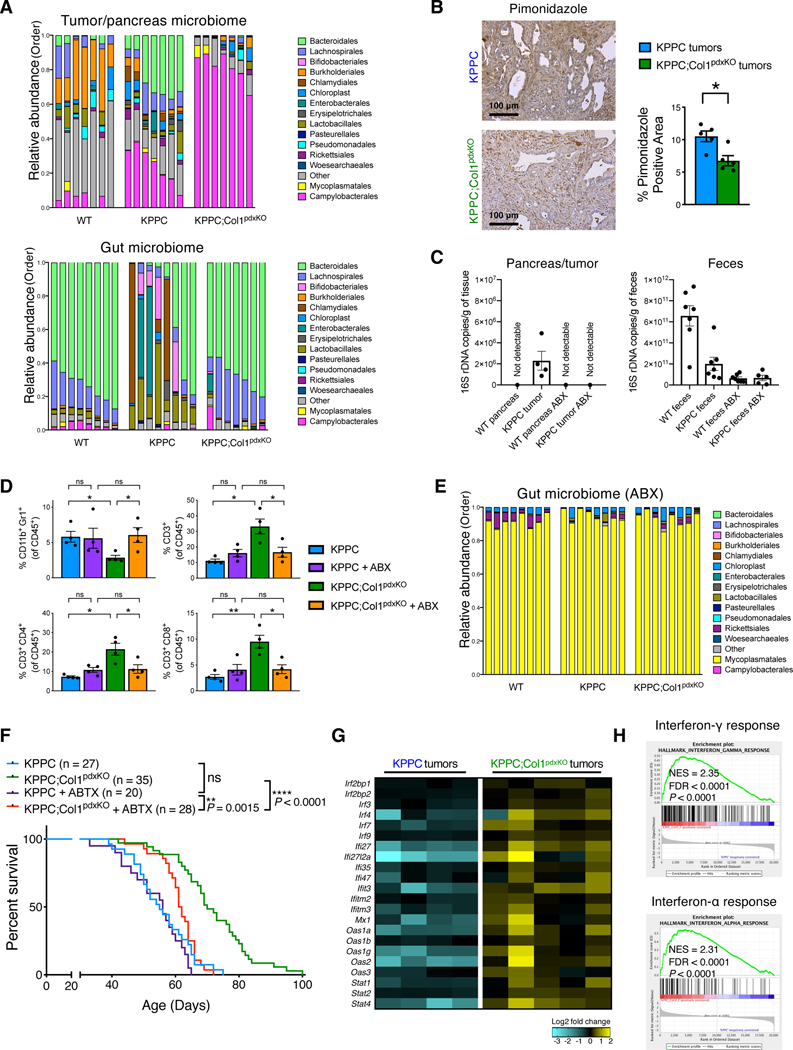
Figure 7. Col1 homotrimer deletion in cancer cells confers beneficial tumor microbiome and immune landscape.
(A) Bacterial 16S rRNA gene sequencing analysis of intratumoral microbiome and gut (fecal) microbiome from co-housed KPPC mice and KPPC;Col1pdxKO mice with stage-matched end-point tumors (n = 7–8/group). Pancreatic microbiome and gut microbiome from co-housed wild-type (tumor-free) littermate control mice were also shown. Sequences were classified by taxonomy at the Order level.
(B) Representative images of hypoxyprobe/pimonidazole staining and positivity quantification of KPPC and KPPC;Col1pdxKO tumors (n = 5/group). Scale bar: 100 μm.
(C) The evaluation of total bacterial DNA content by 16S rRNA gene qRT-PCR. Pancreatic tissue (as pancreatic tumor or normal pancreas) samples (n = 4/group) and fecal samples (n = 5–7/group) were collected from KPPC mice and healthy (tumor-free) littermate mice, treated with either broad-spectrum antibiotics (ABX) or vehicle.
(D) Immune profiling (flow cytometry) assay of CD11b+Gr1+ myeloid cells, CD3+ T cells, CD4+/CD3+ T cells, and CD8+/CD3+ T cells in the tumors from KPPC mice and KPPC;Col1pdxKO mice with or without ABX treatment (n = 4/group).
(E) Bacterial 16S rRNA gene sequencing analysis of gut microbiome (fecal samples) from mice with ABX treatment (n = 8/group). Sequences were classified by taxonomy at the Order level.
(F) The overall survival of KPPC mice (n = 20) and KPPC;Col1pdxKO mice (n = 28) with ABX treatment, compared with untreated KPPC and KPPC;Col1pdxKO mice (originally shown in Figure 2B). Log-rank (Mantel-Cox) test was used.
(G and H) Significantly upregulated expression of interferon response pathway genes (G) in KPPC;Col1pdxKO tumors (n = 5) compared to KPPC tumors (n = 4), based on bulk RNA-seq data. GSEA revealing significantly upregulated interferon pathways was shown in (H).
Data are represented as mean ± SEM. *p < 0.05, **p < 0.01, ****p < 0.0001; NS: not significant, Student’s t test was used unless otherwise indicated.
See also Figures S5, S6, and S7; Table S3.

