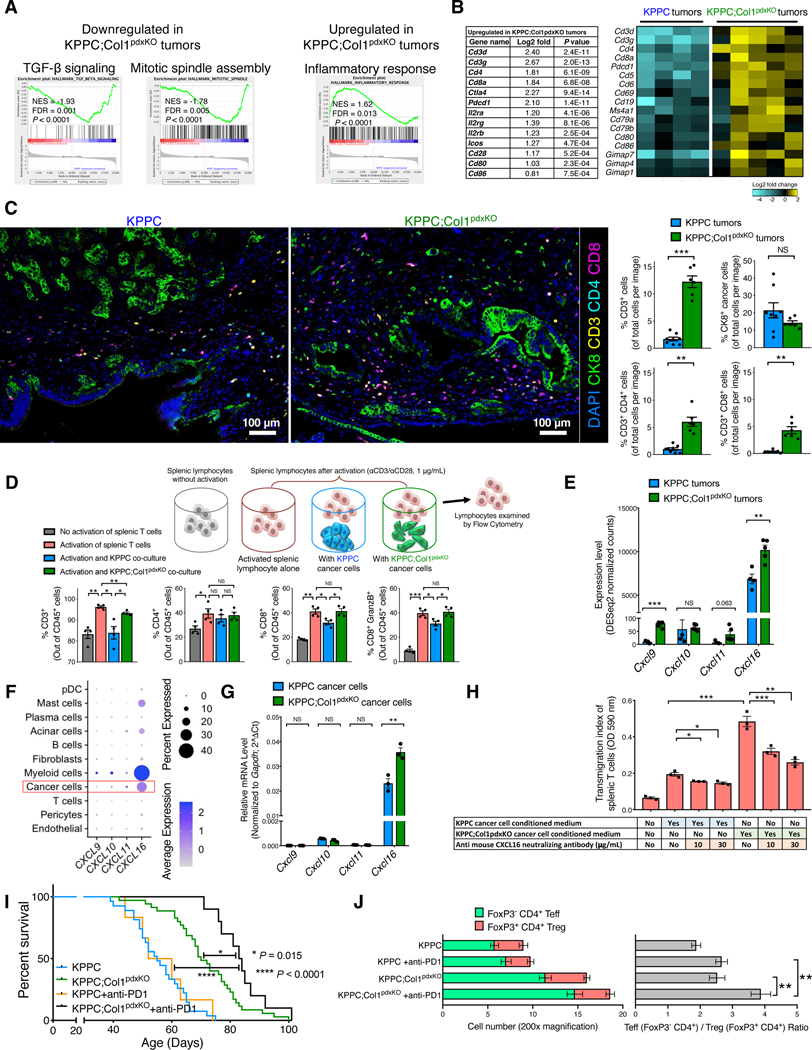
Figure 8. Deletion of Col1 homotrimers from cancer cells increases T cell accumulation and enables the efficacy of anti-PD-1 therapy.
(A and B) GSEA revealing differentially regulated pathways in KPPC;Col1pdxKO tumors (n = 5), as compared to KPPC tumors (n = 4) (A), based on bulk RNA-seq data (partly shown in Figures 7G and 7H). Upregulated T cell signature genes in KPPC;Col1pdxKO tumors were listed with log2-fold change and P value (Wald Test) in (B). Heatmap of representative genes encoding immune regulatory molecules was also shown.
(C) T cell quantification from multispectral imaging of multiplex stained sections of stage-matched endpoint KPPC tumors (n = 8) and KPPC;Col1pdxKO tumors (n = 6). Scale bar: 100 μm.
(D) Splenic lymphocytes (n = 4 mice) were cultured in the presence or absence of: anti-CD3/anti-CD28 activation, KPPC cancer cell co-culture, or KPPC;Col1pdxKO cancer cell co-culture. Lymphocytes were then examined by flow cytometry.
(E) Expression profile of genes encoding chemokines related to T cell recruitment based on bulk RNA-seq of KPPC (n = 4) and KPPC;Col1pdxKO (n = 5) tumors.
(F) Expression profile of indicated genes among various cell clusters from the single-cell RNA-sequencing dataset of human pancreatic tumors (GSA: CRA001160), as shown in dot plot.
(G) Expression profile of indicated genes in KPPC and KPPC;Col1pdxKO cancer cells (n = 3) as examined by qRT-PCR.
(H) Transwell migration assay of mouse splenic T cells (in upper chambers, treated with vehicle or CXCL16 neutralizing antibody) towards conditioned medium from KPPC or KPPC;Col1pdxKO cancer cells (n = 3).
(I,J) Survival of KPPC;Col1pdxKO (n = 10) and KPPC mice (n = 6) treated with anti-PD-1 therapy (I), compared to untreated KPPC (n = 27) and KPPC;Col1pdxKO (n = 35) mice originally from Figure 2B. Log-rank (Mantel-Cox) test was used. Indicated cell number and ratio were examined by immunofluorescence (J).
Data are represented as mean ± SEM. *p < 0.05, **p < 0.01, ***p < 0.001, ****p < 0.0001; NS: not significant, Student’s t test was used unless otherwise indicated.
See also Figures S7 and S8; Table S3.

