
FIGURE 1.
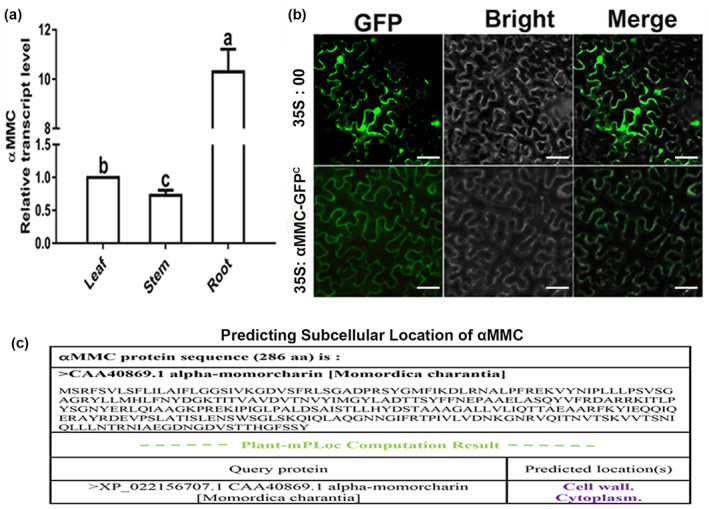
Subcellular localization of αMMC in Nicotiana benthamiana. (a) Organ‐specific expression of the αMMC gene in plants. Expression levels were standardized to Actin, the results of the leaf were set at 1. Values indicate the mean ± SD from three independent experiments and lowercase letters represent significant differences (p < 0.05). (b) The 35S:αMMC‐GFPC construct was agro‐infiltrated into N. benthamiana leaves and detected by fluorescence microscopy. The empty vector (35S:00) served as the control. (c) Predicting subcellular location of αMMC. The αMMC sequence was also analysed through the web‐server predictors of plant‐mPLoc