
FIGURE 2.
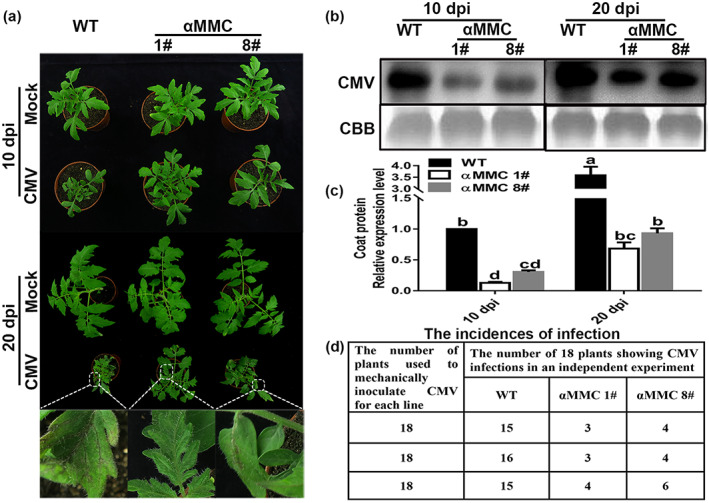
The αMMC‐overexpressing lines promote resistance to CMV infection. (a) Disease symptoms in the wild‐type (WT) plants and the αMMC transgenic plants at 10 days postinoculation (dpi) and 20 dpi. Magnified images of leaves (in white boxes) are shown in the lower panels. Detection of viral coat protein accumulation by (b) western blotting and (c) reverse transcription‐quantitative PCR (RT‐qPCR) analysis. Systemic leaves were harvested for analysis. Coomassie brilliant blue (CBB) staining of RuBisCO protein indicates the loading control. Values indicate the means ± SD from three independent experiments and lowercase letters represent significant differences (p < 0.05). (d) Incidences of CMV infection determined by RT‐qPCR and the visual assessment of disease symptoms of 18 individual plants per line at 40 dpi from three independent experiments