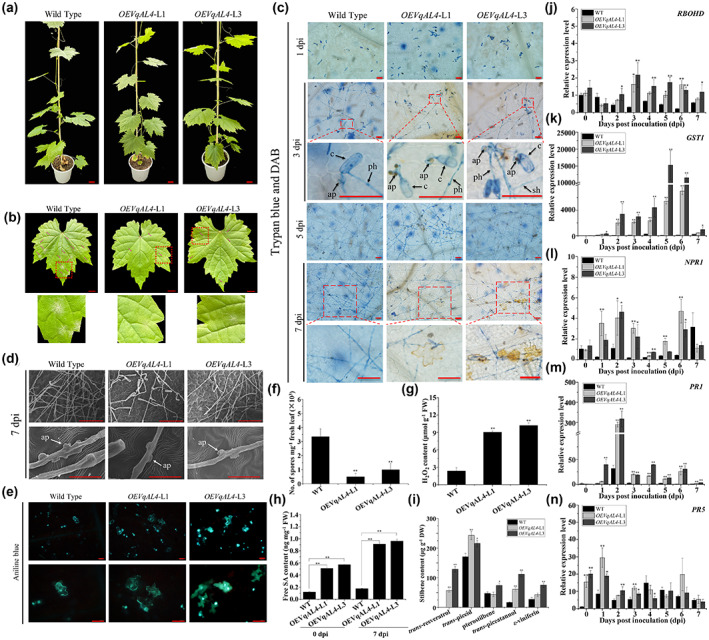
FIGURE 7.

Overexpression of VqAL4 in grapevine enhances resistance to Uncinula necator by promoting stilbene accumulation and activating expression of resistance genes. (a) Photograph of VqAL4 transgenic lines and wild‐type Thompson Seedless before U. necator inoculation. Bars = 1 cm. (b) Photograph of leaves of VqAL4 transgenic lines and wild‐type Thompson Seedless at 7 days postinoculation (dpi). Bars = 1 cm. (c) Trypan blue staining and 3,3′‐diaminobenzidine (DAB) staining show the hyphal growth of U. necator and H2O2 accumulation at 1, 3, 5, and 7 dpi. c, conidium; ap, appressorium; ph, primary hypha; sh, secondary hypha. Bars = 100 μm. (d) Scanning electron micrographs of the hyphae and appressoria (ap) of U. necator in VqAL4 transgenic lines and wild‐type Thompson Seedless. Upper figures, bars = 100 μm; lower figures, bars = 20 μm. (e) Aniline blue staining showing callose depositions in U. necator‐infected epidermal cells at 7 dpi. Bars = 50 μm. (f) Quantification of spores per mg fresh leaves from VqAL4 transgenic lines and wild‐type Thompson Seedless at 7 dpi. (g) H2O2 content of VqAL4 transgenic lines and wild‐type Thompson Seedless leaves at 7 dpi. (h) Free salicylic acid (SA) content in the leaves of VqAL4 transgenic lines and wild‐type Thompson Seedless at 0 dpi and 7 dpi. (i) Determination of five stilbene contents in the leaves of VqAL4 transgenic lines and wild‐type Thompson Seedless at 7 dpi. (j, k) Reverse transcription‐quantitative PCR (RT‐qPCR) analysis was conducted to determine the relative transcript levels of H2O2‐related genes in VqAL4 transgenic lines after U. necator inoculation. WT, wild‐type Thompson Seedless. (l–n) RT‐qPCR analysis was conducted to determine the relative transcript levels of SA‐related genes in VqAL4 transgenic mutants after U. necator inoculation. The standard deviation (SD) was calculated from three independent replicates. One‐way analysis of variance (Tukey's test) was carried out. Asterisks indicate significant differences at *p < 0.05, **p < 0.01.
