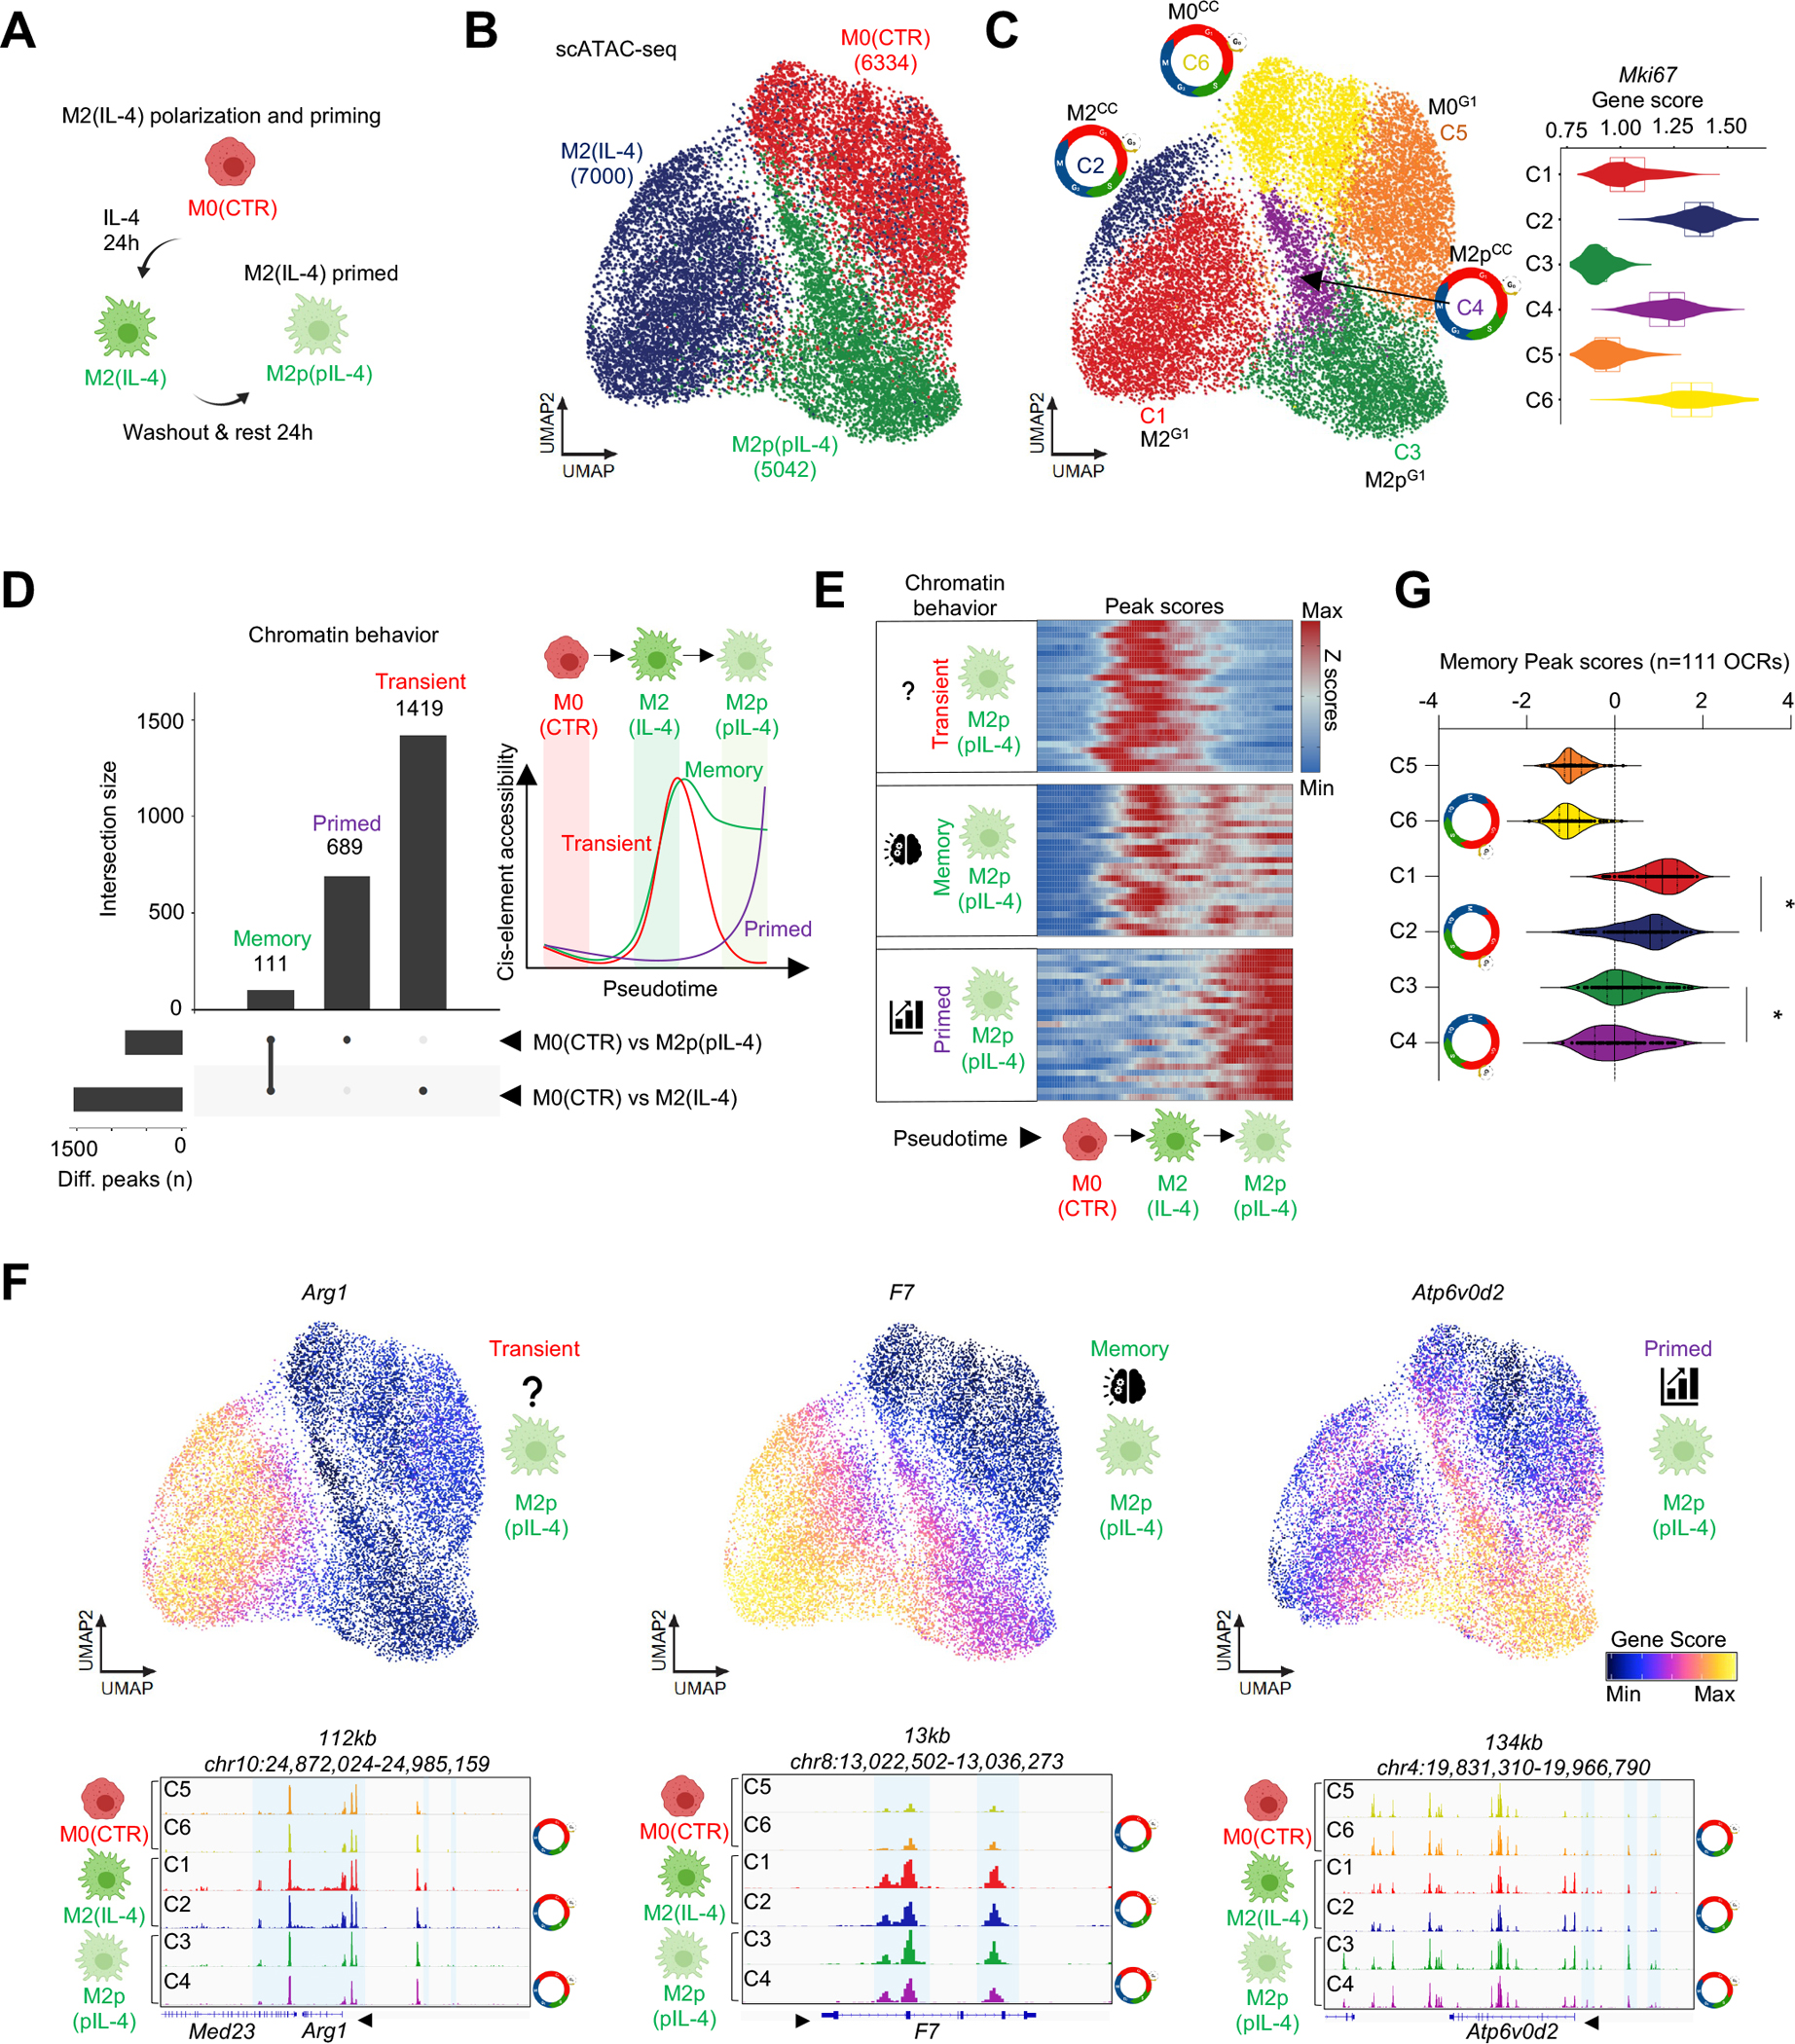
Figure 5. Cell cycle negatively affects the formation of memory in a MF subset at the chromatin level.

(A) Scheme of the priming model. (B) scATAC-seq UMAP of M0(CTR), M2(IL-4) and primed M2p(pIL-4) MFs. (C) UMAP colored by the 6 clusters identified. Violin plot depicts the gene score values of Mki67 in the 6 clusters. Cell cycle icons highlight cycling MF clusters. (D) Upset plot of the differentially accessible cis-elements in among the indicated conditions, and their overlap, yielding “memory”, “primed” and “transient” chromatin features. Scheme of revealed chromatin behaviors. (E) Heatmap of peak scores that exhibit chromatin behaviors from panel D over the indicated pseudotime trajectory. 25 peaks are shown (F) UMAPs depict gene score values for the indicated genes that display different chromatin behaviors. Genome browser views depict scATAC-seq signal in the indicated gene loci. (G) Violin plot depicts of the distribution of “Memory” peak scores (accessibility) across the clusters. Statistics: Wilcoxon Signed Rank Test between medians, p<0.0001.
