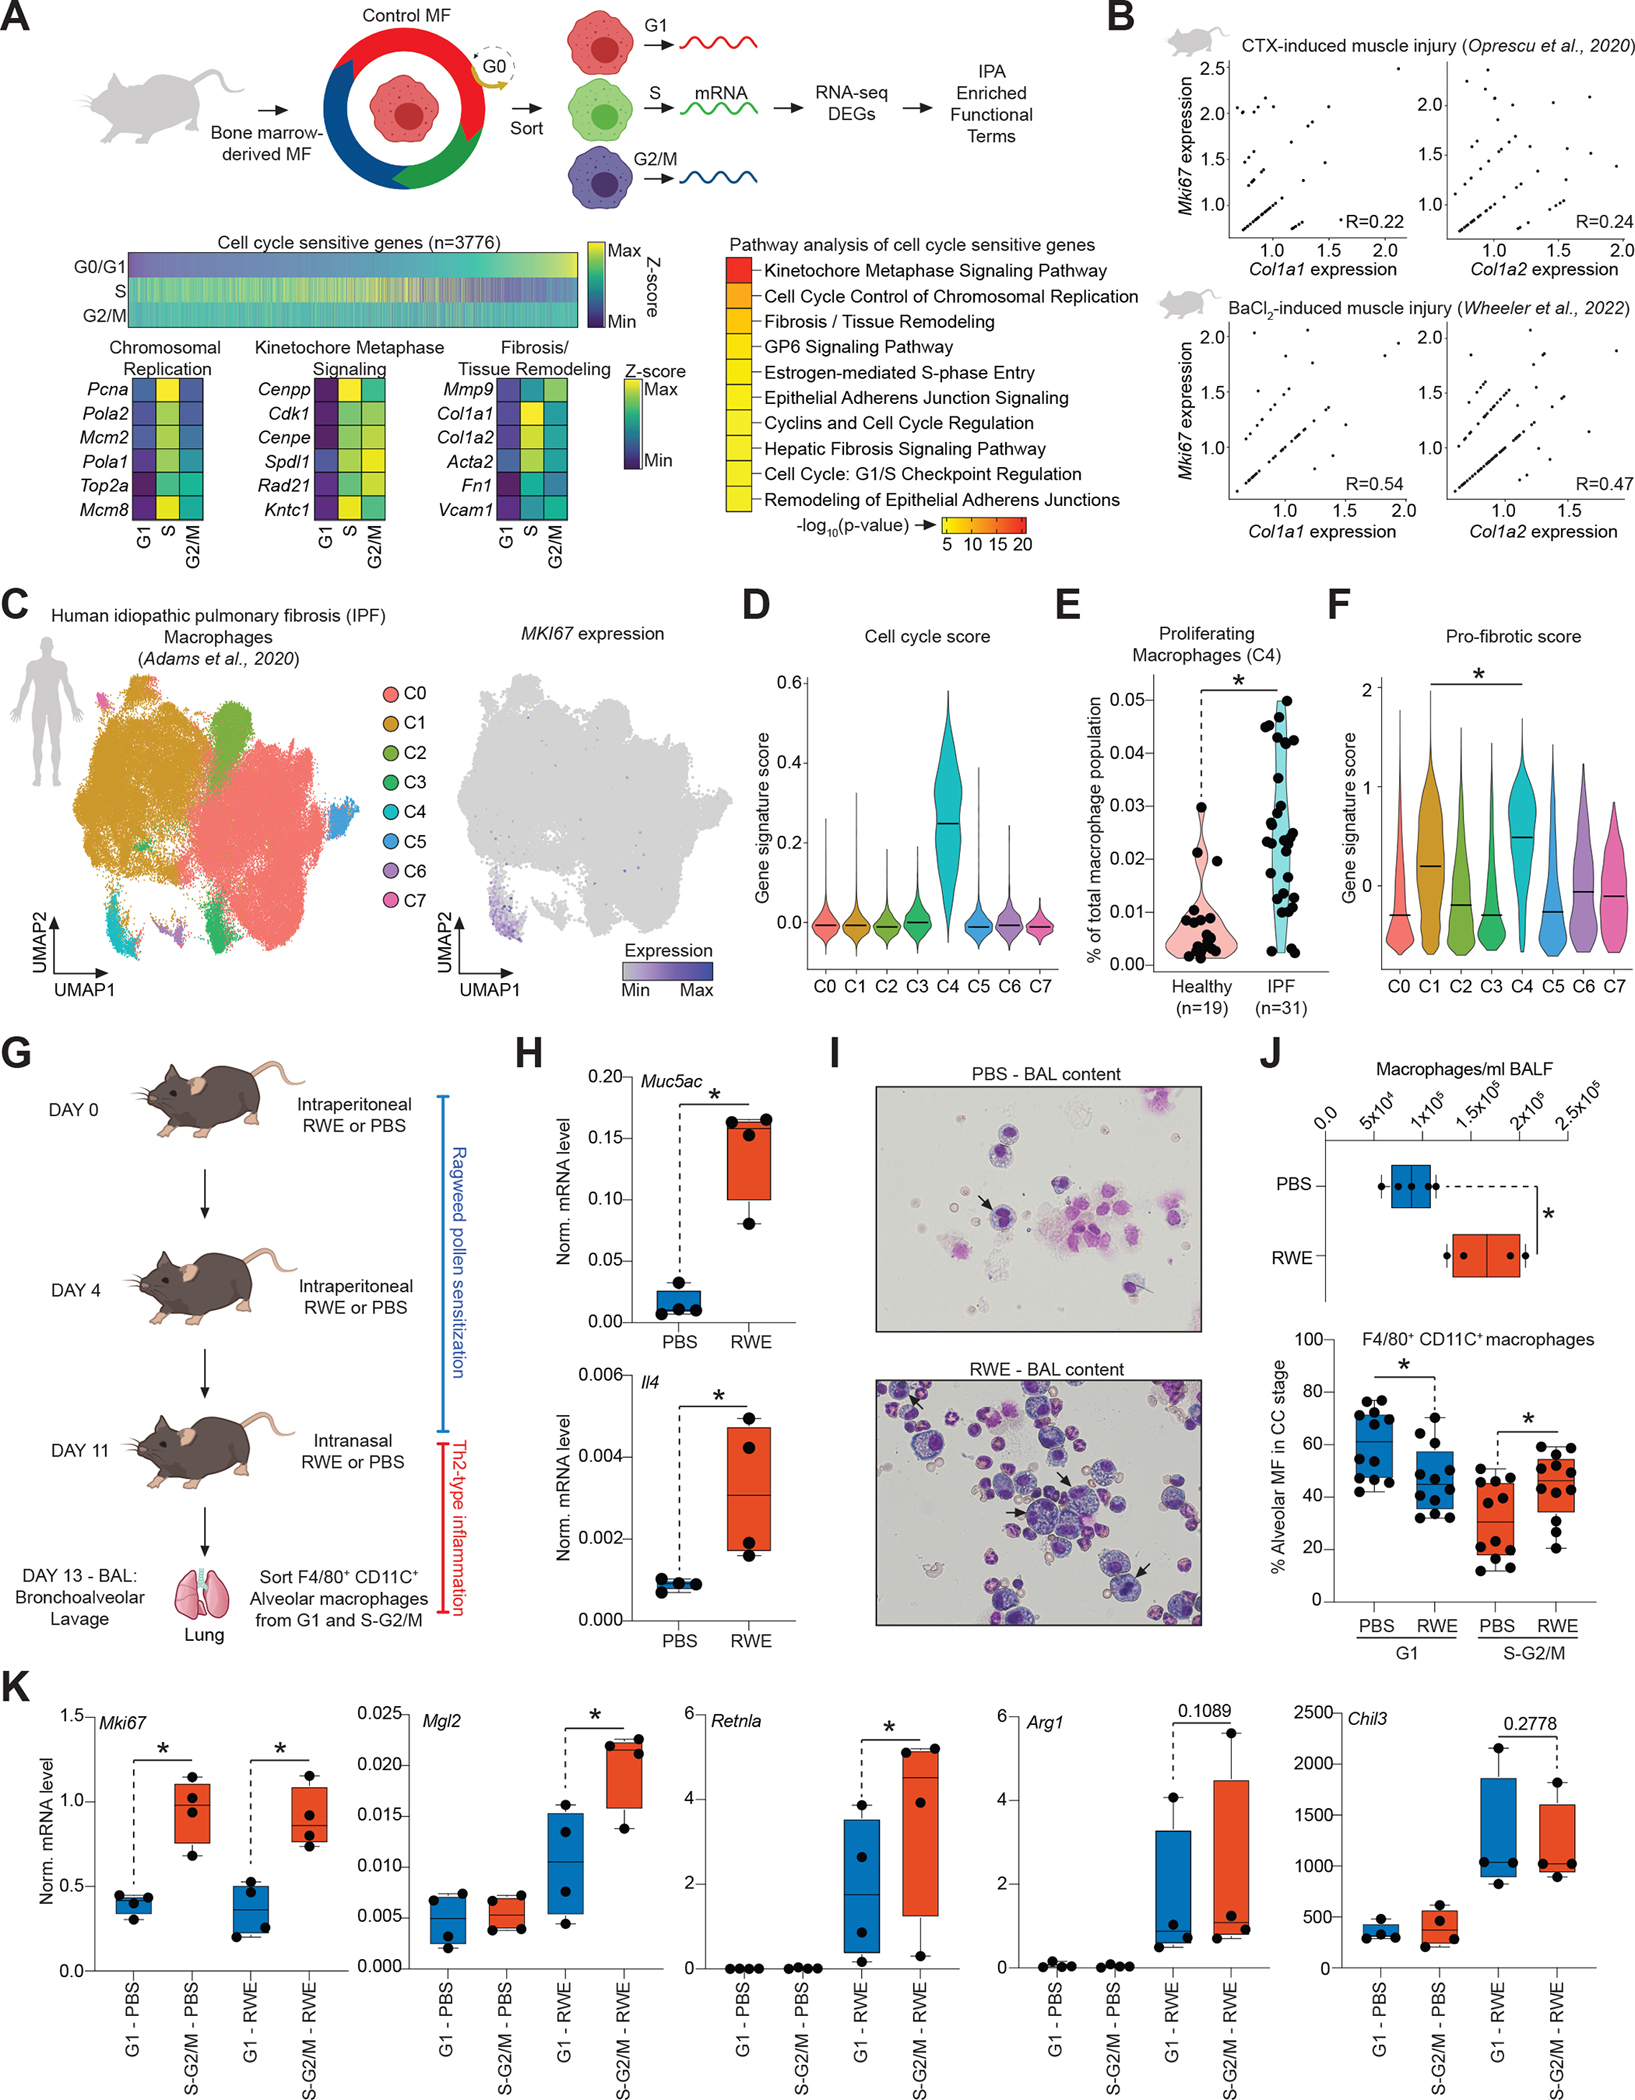
Figure 7. Cycling MFs express tissue regeneration genes.

(A) Experimental scheme. DEGs – differentially expressed genes, IPA – Ingenuity Pathway Analysis. Heatmap represents DEGs across cell cycle phases in M0(CTR) MFs. IPA of the DEGs. Top 10 enriched biological functions are shown. Expression of a select set of genes from the first three enriched biological functions are shown as determined by bulk RNA-seq. (B) Feature scatter plots of the indicated gene pairs visualizing co-expression in single MFs (Log2Normalized Expression) with Pearson correlation coefficients. (C) scRNA-seq UMAP of human MFs from idiopathic pulmonary fibrosis (IPF) colored by the identified clusters. UMAP colored by the expression level of MKI67. (D) Violin plot represents the enrichment of a cell cycle gene signature score across clusters. (E) Violin plot represents the fraction of proliferating MFs in cluster 4 from control (Healthy) and IPF lungs. (F) Violin plot represents the enrichment of a pro-fibrotic gene signature score across MF clusters. Statistics: Wilcoxon Signed Rank Test at p<0.0001. (G) Scheme of the in vivo experimental system to induce Th2-type inflammation. (H) Boxplots depict the mRNA expression levels of the indicated genes. Statistics: two tailed, unpaired t-test at p<0.05, n=4. (I) Representative images of bronchoalveolar lavage (BAL) contents. (J) Quantification of MF numbers in the BAL fluid (n=4; top). Fraction of alveolar MFs in G1 and S-G2/M cell cycle phases in the indicated conditions. Statistics: two tailed, unpaired t-test at p<0.05, n=12. (K) Boxplots depict gene expression in alveolar MFs from cell cycle-phases in PBS or RWE-treated animals. Statistics: one tailed, paired t-test at p<0.05, n=4. All boxplots: box center line, median; limits, upper and lower quartiles; whiskers, 1.5× interquartile range.
