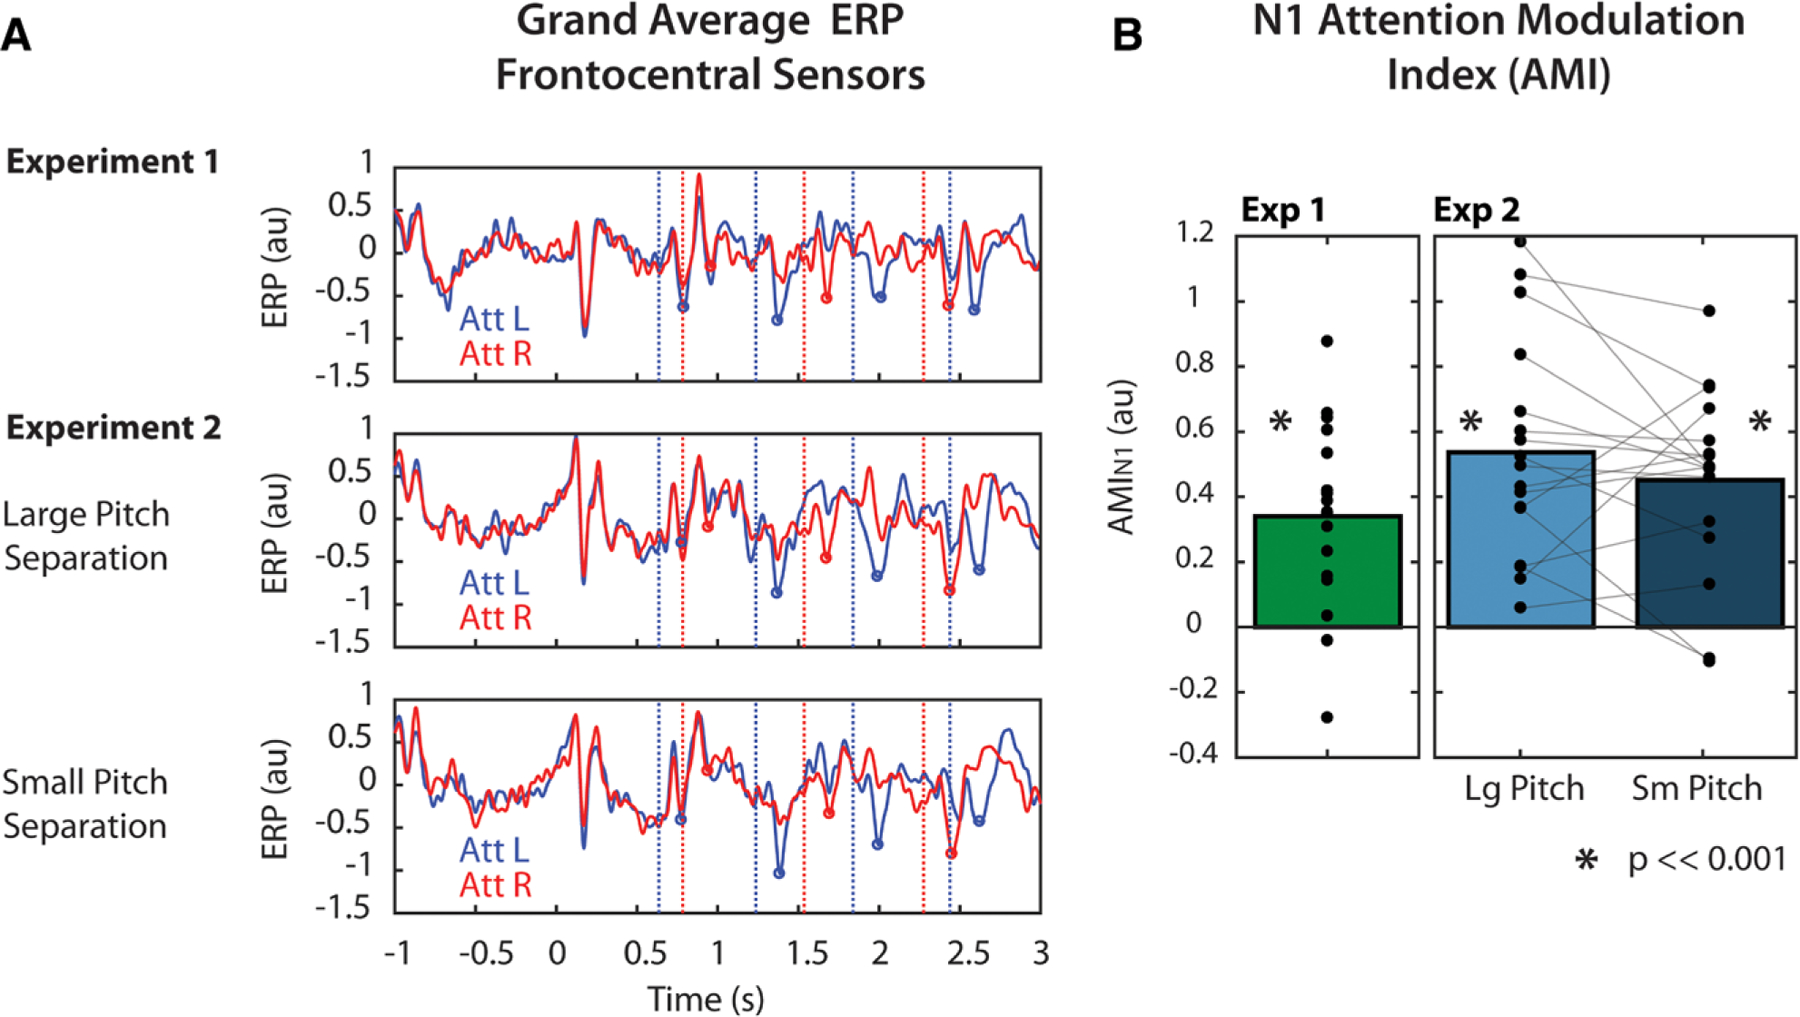
Fig. 3.

Attentional modulation of the N1 response. A, Grand average (n = 17) normalized event-related potential (ERP) responses over time in Experiment 1 (top) and Experiment 2 (bottom). ERPs were averaged across frontocentral electroencephalography (EEG) sensors. Red and blue vertical lines indicate right and left note onset times, respectively. Red and blue circles indicate the identified N1 peak amplitudes in response to right and left notes, respectively. B, N1 modulation summarized as AMIN1. Individual points indicate individual subject AMIN1, calculated from Eq. 1. Asterisks indicate that AMIN1 was significantly greater than zero at the p = 0.001 significance level (one-sided, one-sample t test, corrected for multiple comparisons). AMI indicates attentional modulation index.
