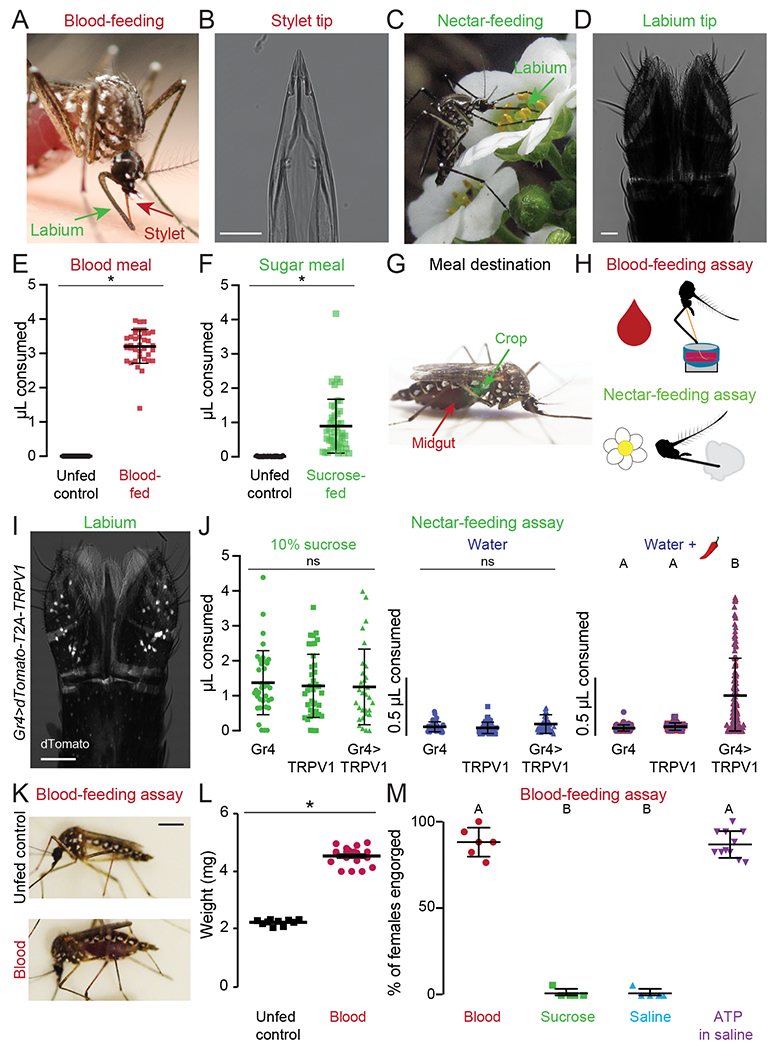
Figure 1. Sensory Detection Prior to Blood and Nectar Feeding.

(A,C) An Ae. aegypti female feeding on human skin (A, Photo: Benjamin Matthews) or flower nectar (C, Photo: Eric Eaton).
(B,D) Transmitted light image of the female stylet (B) or labium (D). Scale bars: 25 μm
(E,F) Volume of meal consumed after presenting blood (E) or sugar (F). Unfed controls were not given the option to feed and therefore represent the baseline for the assay. Each data point represents 1 female (mean ± SD, N=37-46; * p < 0.05 Mann-Whitney test).
(G) Ae. aegypti female with a blood meal in the midgut (red) and a 10% sucrose meal in the crop (green). Green food dye added to 10% sucrose to visualize meal location.
(H) Schematic of blood- (top) and nectar-feeding (bottom) behavior assay.
(I) Confocal image of dTomato expression in Gr4>dTomato-T2A-TRPV1 labium with transmitted light overlay. Scale bar: 50 μm.
(J) Volume of meal consumed by the indicated genotypes. Each data point represents 1 female: 10% sucrose N=30-40 females/genotype; water N=41-60 females/genotype; water + 50 μM capsaicin (red chili pepper): Gr4 N=61, TRPV1 N=62, Gr4>TRPV1 N=124 females.
(K) Female mosquitoes following 15 min exposure to different meals. Scale bar, 1 cm.
(L) Sampled weight measurements from data for engorged females offered blood or unfed controls not offered any meal; N=10-19 weight measurements/meal (mean ± SEM; * p < 0.05 unpaired t-test).
(M) Female engorgement on the indicated meal delivered via Glytube. Each data point denotes 1 trial with 15-20 females/trial: N=5-11 trials/meal.
In (J, M) data labeled with different letters are significantly different from each other (mean ± SD; Kruskal-Wallis test with Dunn’s multiple comparison, p < 0.05).
See Figure S1 for chemogenetic and blood-feeding behavioral experiments.
