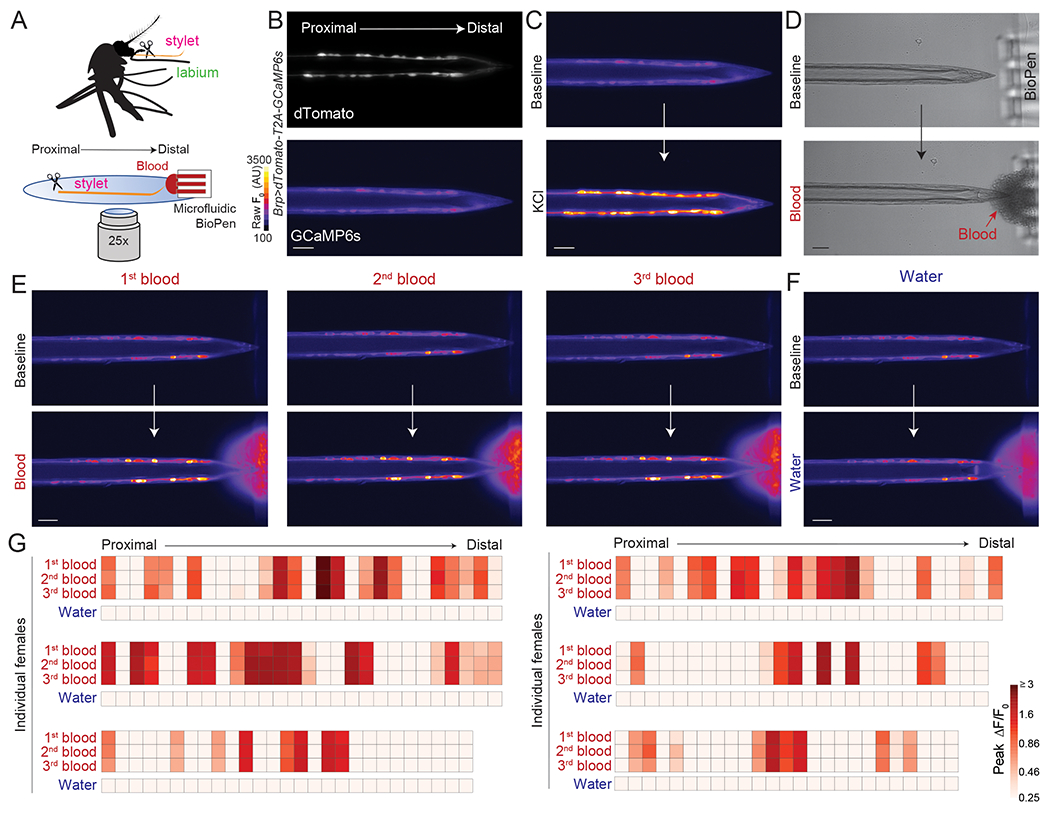
Figure 4. Sexually Dimorphic Stylet Neurons Directly Sense Blood.

(A) Schematic of ex vivo stylet imaging preparation.
(B) Wide-field image of dTomato (top) and baseline GCaMP6s (bottom, scale: arbitrary units) for a representative stylet, oriented proximal to distal.
(C) Representative image of GCaMP6s fluorescence increase to bulk neuronal depolarization with 500 mM KCl (bottom) compared to baseline (top).
(D) Representative bright-field image before (top) and during (bottom) delivery of sheep blood to the stylet tip via the BioPen.
(E,F) Representative image of GCaMP6s fluorescence increase to indicated blood presentation (bottom, E) or water control (bottom, F), compared to baseline (top).
(G) Heat maps of peak ΔF/F0 response to the indicated ligand. Each square is the average of the peak ΔF/F0 measured in 3 separate trials. Each column represents 1 neuron and each row represents the response to indicated ligand for all neurons from 1 individual female, with neurons ordered from proximal to distal. N=6 individual females. In (B-F) scale bar: 25 μm. 0.0002% fluorescein was added to blood and water stimuli to visualize ligand delivery zone.
See Video 3, 4 for representative movies of BioPen stimulus delivery and stylet responses to blood or water, and Figure S3 for details on calcium imaging analysis.
