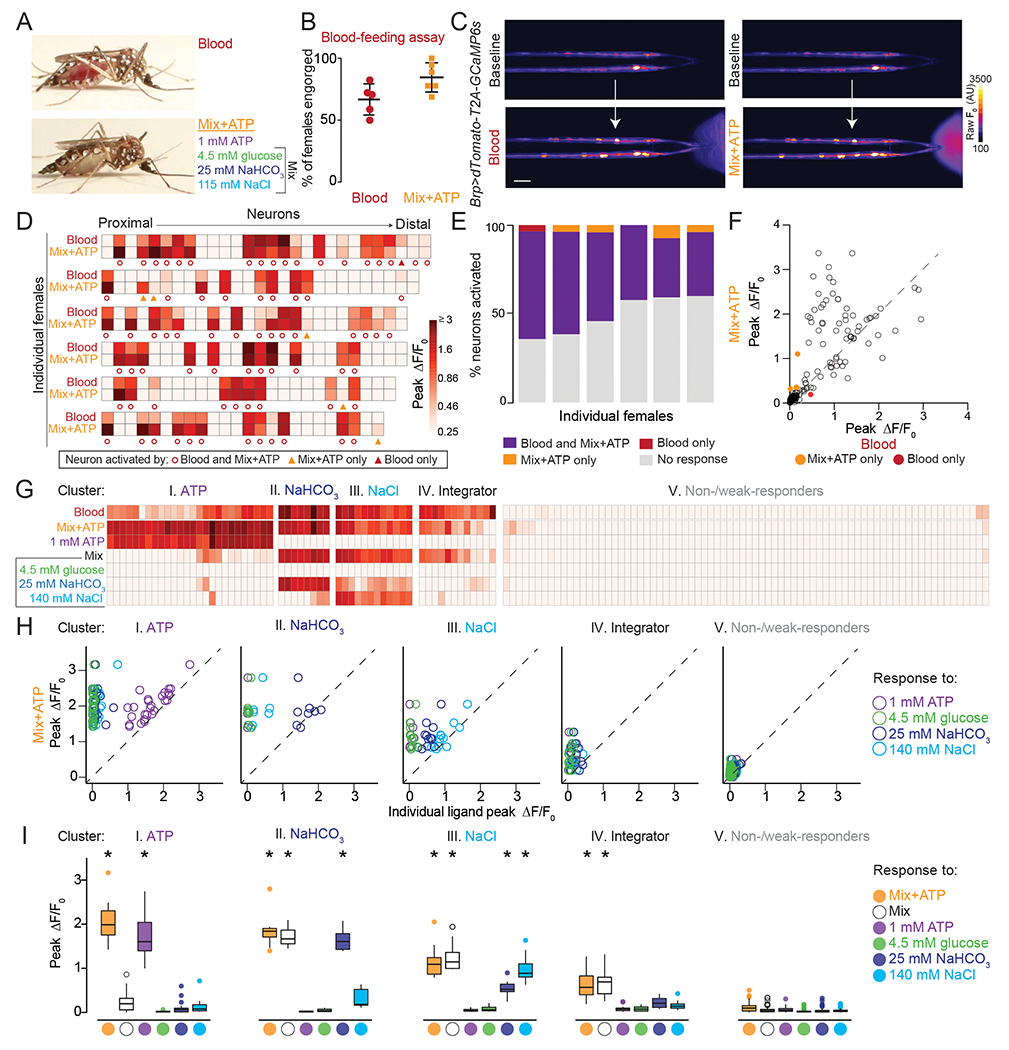
Figure 5. Stylet Neurons Integrate Across Taste Modalities to Detect Blood.

A) Representative engorged Ae. aegypti female following 15-min exposure to blood (top) or Mix+ATP (bottom) via Glytube assay.
(B) Female engorgement on blood (N=5 trials) and Mix+ATP (N=6 trials) delivered via Glytube (lines denote mean ± SD, 15–20 females/trial, p = 0.0714, Mann-Whitney test).
(C) Representative image of GCaMP6s fluorescence increase (scale: arbitrary units) to blood (bottom, left) or Mix+ATP (bottom, right), compared to baseline (top). Scale bar: 25 μm.
(D) Heat maps of peak ΔF/F0 response to the indicated ligand. Each square is the average of 3 ligand exposures and each column represents one neuron. Each row represents the response to indicated ligand for all neurons from 1 individual female, with neurons ordered from proximal to distal. N=6 individual females.
(E) Summary of % neurons with ≥ 0.25 peak ΔF/F0 to the indicated ligand from (D), each column represents 1 female.
(F) Scatter plot comparing peak ΔF/F0 in response to Mix+ATP (y-axis) and blood (x-axis) summarized across N=6 females from (D,E). Each dot represents 1 neuron, dots that fall on the dashed line have the same peak ΔF/F0 in response to blood and Mix+ATP. Dots that fall above the line respond more to Mix+ATP than to blood and dots that fall below the line respond more to blood than to Mix+ATP.
(G-I) 5 clusters of blood-sensitive neurons identified by unsupervised hierarchical clustering of peak ΔF/F responses to the ligands indicated in (G). Clustering removes proximal-distal ordering and female identity. N=5 females (* p < 0.05, one-sample Wilcoxon signed-rank test).
In (A-I) and all subsequent experiments “Mix” is 4.5 mM glucose, 25 mM NaHCO3, 115 mM NaCl and “Mix+ATP” is Mix supplemented with 1 mM ATP. To visualize ligand delivery zone, 0.0002% and 0.00002% fluorescein was added to blood and Mix+ATP, respectively, in BioPen experiments.
See Video 5 for representative movies of stylets responding to blood and Mix+ATP, Data File 1 for raw imaging data and p values for Figure 5I, Figure S4 for responses of individual females to blood components, and Figure S5 for details of the hierarchical clustering method.
