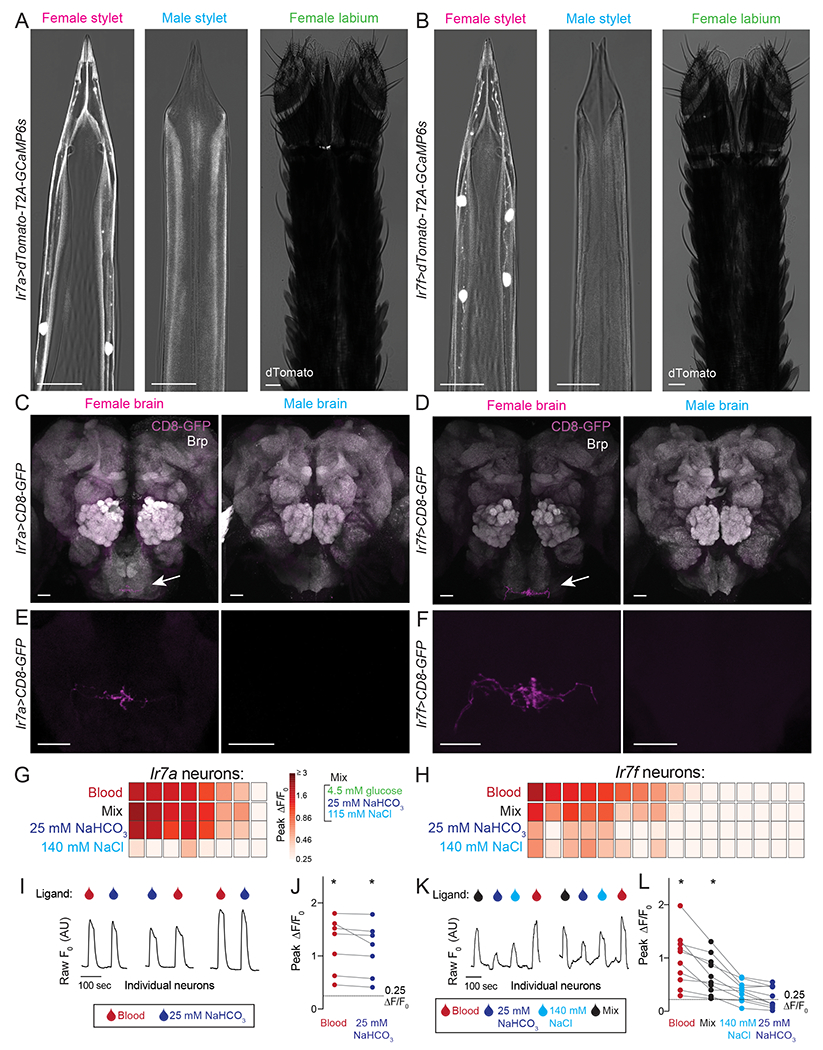
Figure 6. Ir7a and Ir7f Mark the NaHCO3 and Integrator Neurons.

(A,B) Confocal image with transmitted light overlay of dTomato expression (gray) in the female stylet (left panel), male stylet (middle panel), and female labium (right panel) of Ir7a>dTomato-T2A-GCaMP6s (A) and Ir7f>dTomato-T2A-GCaMP6s (B) animals. Ir7a expression: 10/13 females = 2 neurons, 2/13 females = 1 neuron, 1/13 females = 0 neurons. Ir7f expression: 6/11 females = 4 neurons, 5/11 females = 3 neurons.
(C-F) mCD8:GFP expression (magenta, white arrow) of Ir7a>mCD8:GFP (C,E) and Ir7f>mCD8:GFP (D,F) in female (left) and male (right) brain (top) and subesophageal zone (bottom). Neuropil in C and D is labeled with anti-Drosophila Brp (gray). The brain and subesophageal zone images in C-F were acquired from different individuals.
(G,H) Heat maps of peak ΔF/F0 response to the indicated ligand in Ir7a>dTomato-T2A-GCaMP6s (G) and Ir7f>dTomato-T2A-GCaMP6s (H) neurons across N=5 females. Each square is the average of 3 ligand exposures and each column represents one neuron. Columns are sorted by largest to smallest peak ΔF/F0 in response to blood.
(I,K) Raw F0 traces from individual neurons in response to indicated ligand.
(J,L) For blood-sensitive neurons, peak ΔF/F0 to indicated ligand. Each data point denotes the response from 1 neuron and responses from the same neuron are connected by a line (* p < 0.05, one-sample Wilcoxon signed-rank test).
In (A-F) scale bar: 25 μm. 0.0002% fluorescein was added to blood and 140 mM NaCl, and 0.00002% was added to Mix and 25 mM NaHCO3 in the BioPen to visualize ligand delivery zone.
See Video 6 for confocal Z-stack movies of Ir7a- and Ir7f- labeled neurons, Figure S6 for RNA-seq data and behavioral analysis of Ir7a and Ir7a mutants and chemogenetic manipulation, and Data File 1 for p values for Figure 6J,L.
