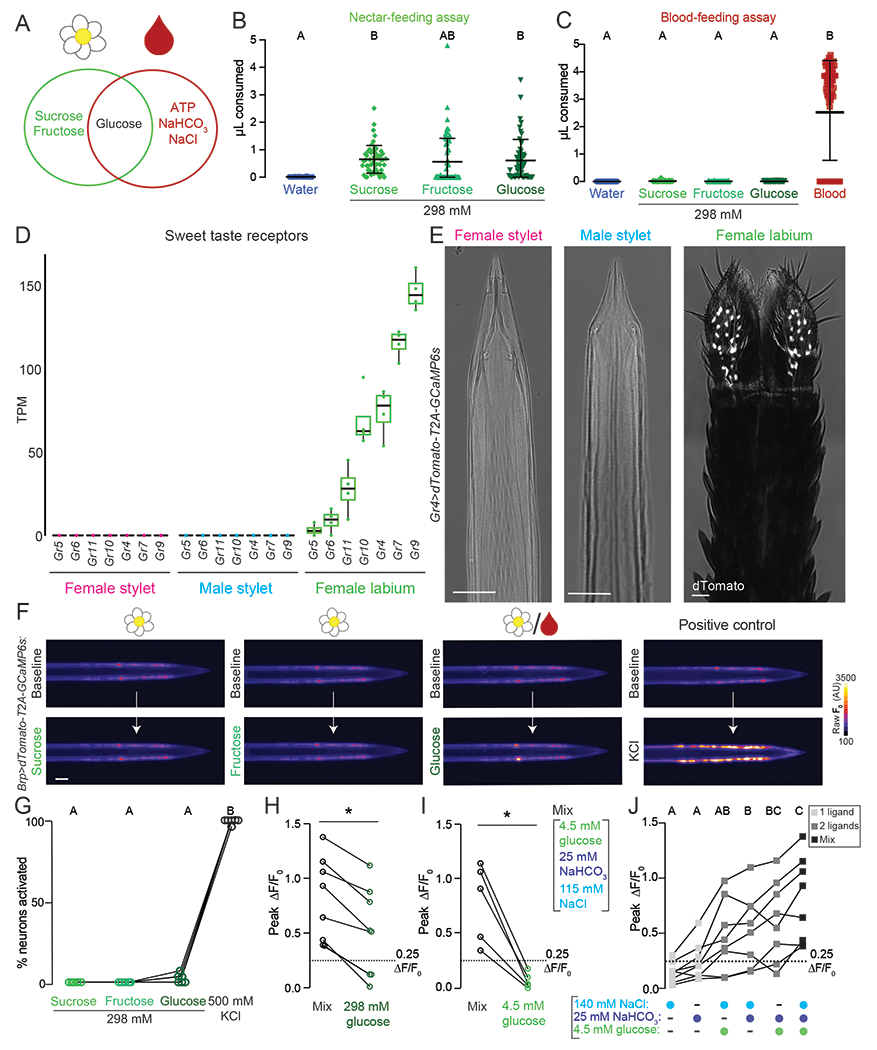
Figure 7. The Stylet is Specialized to Detect Blood over Nectar.

(A) Venn diagram schematizing the similarity and differences between nectar (left circle) and blood (right circle) components.
(B,C) Volume of indicated meal consumed in the nectar-feeding (B) and blood-feeding (C) assay. Each data point represents 1 female: water N=36-40; sucrose N=53–60; fructose N=40-74; glucose N=55-59. Blood in (C) is a positive control for blood-feeding assay, N=76 females.
(D) Sweet taste receptor expression from RNA-seq analysis of the indicated tissues. N=4 replicates/tissue. Median indicated by black line, bounds of box represent first and third quartile, whiskers are 1.5 times the inter-quartile range, and dots represent TPM value from each biological replicate. The outlier is denoted by a dot without whisker.
(E) Confocal image with transmitted light overlay of dTomato expression (gray) in the female stylet (left panel), male stylet (middle panel), and female labium (right panel) of Gr4>dTomato-T2A-GCaMP6s animals. Scale bar: 25 μm.
(F) Representative image of GCaMP6s fluorescence increase to indicated 298 mM sugar presentation (bottom) compared to baseline (top). Flower/blood symbol (3rd from left) indicates that sugar is found in nectar and blood.
(G) Quantification of % neurons with ≥ 0.25 peak ΔF/F0 to the indicated ligand, each data point denotes the response from 1 female, responses from the same female are connected by a line, N=6 females.
(H,I) For Integrator neurons, peak ΔF/F0 to 298 mM glucose (H, N=8 neurons) and 4.5 mM glucose (I, N=5 neurons). Each dot represents 1 neuron (mean ± SD, * p < 0.05 Mann-Whitney test).
(J) For Integrator neurons, peak ΔF/F0 to indicated ligand(s). Each data point denotes the response from 1 neuron, N=8 neurons. Data labeled with different letters are significantly different from each other (one-way repeated measures ANOVA, with the Geisser-Greenhouse correction and Tukey’s multiple comparisons test, p < 0.05).
In (B,C,G) data labeled with different letters are significantly different from each other (mean ± SD; Kruskal-Wallis test with Dunn’s multiple comparison, p < 0.05) and in (H, I, J) responses from the same neuron are connected by a line.
See Figure S7 for behavioral and imaging data with nectar sugars.
