
Figure 4:
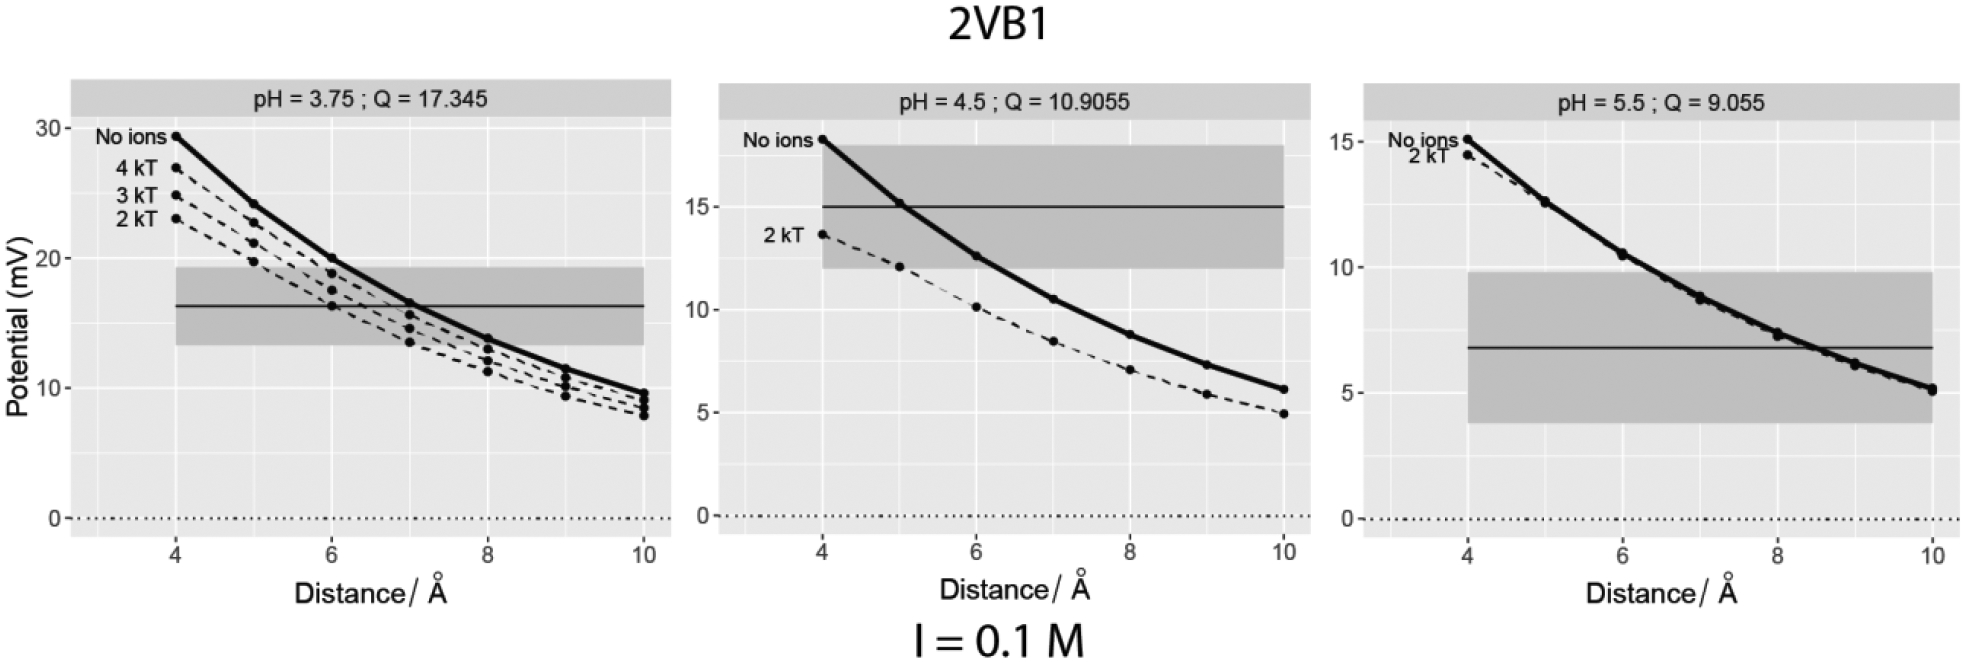
Computed SAEP plotted vs. distance from the vdW surface of Chicken egg Lysosyme (PDB ID: 2VB1). The horizontal solid line depicts the experimental value at the pH mentioned in the plot facets and it is centered at the grey band that denoted the ±3mV. The dotted lines indicate the potentials when explicit ions with adjacent cut-off interaction energies were added using BION.