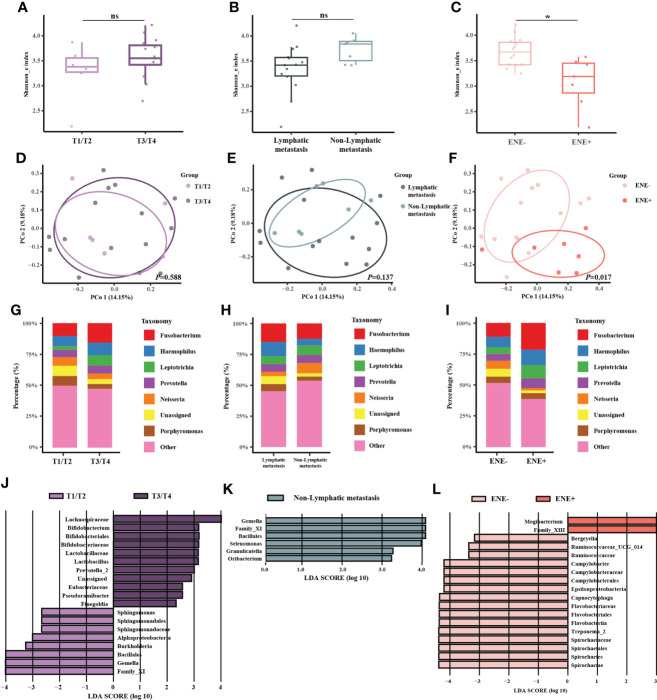
Figure 3.
Microbiome analysis between different T-stages, N-stages, and ENE status. (A–C) Box plot of the alpha diversity of outer tumor tissues between T1/T2-stage and T3/T4-stage, between lymphatic metastasis and non-lymphatic metastasis, and between ENE- and ENE+ shown by Shannon index. The horizontal bars within boxes represent medians. The tops and bottoms of boxes represent the 75th and 25th percentiles, respectively. (D–F) Principal coordinate analysis (PCoA) of outer tumor tissues and normal adjacent tissues based on Bray-Curtis distance. The dots represent the specimens, and the circles represent the microbial community associated with T1/T2-stage (light purple) and T3/T4-stage (dark purple) in (D), lymphatic metastasis (dark green) and non-lymphatic metastasis (light green) in (E), ENE-(light pink) and ENE+ (pink) in (F–I) The microbial composition of different groups at the genera level. (J–L) Significantly different bacteria in the two groups as determined by LEfSe analysis.

