Figure 3.

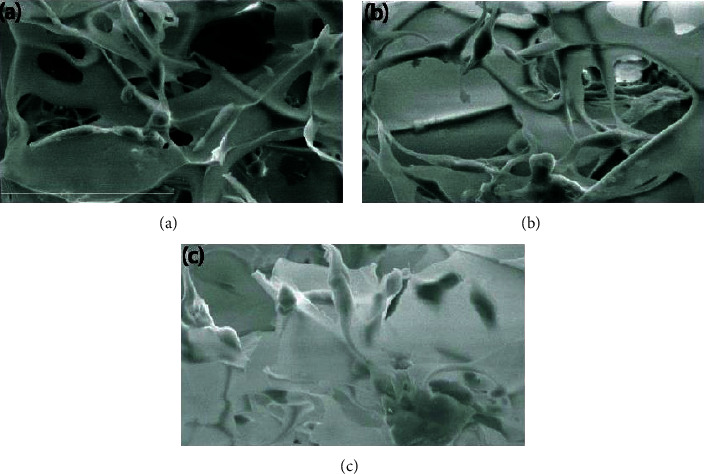
The morphology of the cells on (a) CHI-100, (b) CHI-90, and (c) CHI-80 scaffolds. The scale bar in the images represents 60 μm.

The morphology of the cells on (a) CHI-100, (b) CHI-90, and (c) CHI-80 scaffolds. The scale bar in the images represents 60 μm.