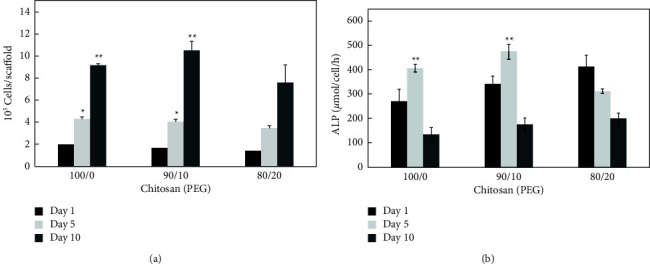
Figure 4.

(a) Cell number of osteoblast after 1, 5, and 10 days of seeding on CHI-100, CHI-90, and CHI-80 scaffolds. The values represent mean ± standard deviation, n = 4. ∗indicates p < 0.05; ∗∗indicated p < 0.001 vs. Day 1 and Day 5. (b) ALP activity of osteoblast after 1, 5, and 10 days of seeding on CHI-100, CHI-90, and CHI-80 scaffolds. The values represent mean ± standard deviation, n = 4. ∗indicates p < 0.05; ∗∗indicated p < 0.001 vs. Day 1 and Day 5.
