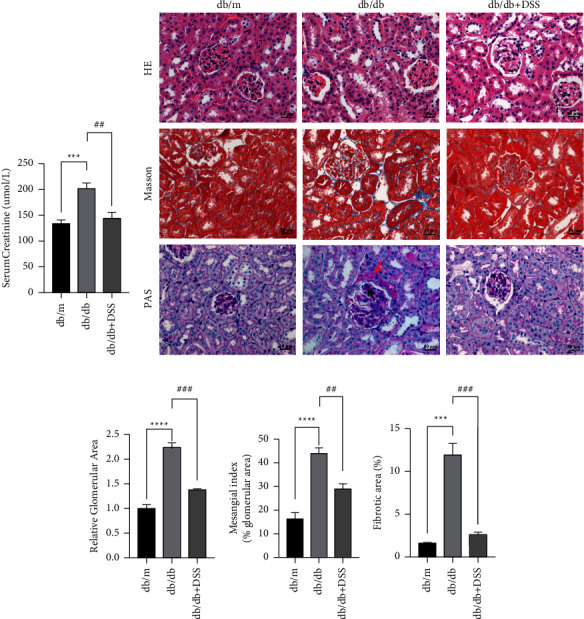
Figure 6.

The effect of DSS treatment on diabetic renal functional and pathological injury in the db/db mice. (a) The comparison of the levels of Scr among the three groups. n = 5 mice per group. (b) HE, PAS, and Masson staining were used to describe the renal characteristics of different groups. The red deposition represented by the red arrow depicts the evident thickening of the basement membrane of the renal capsule as well as the level of pericystic fibrosis. The Kimmelstiel Wilson nodule is represented by the red deposition shown by the black arrow. n = 3 mice per group (×400; scale bar = 50 μm). ((c)–(e)) The relative glomerular area, mesangial index, and interstitial fibrosis score were quantified in the three groups of mice, respectively. n = 3 mice per group (∗∗∗P < 0.001, ∗∗∗∗P < 0.0001 vs. the db/m group; ##P < 0.01, ###P < 0.001 vs. the db/db group).
