Figure 5.
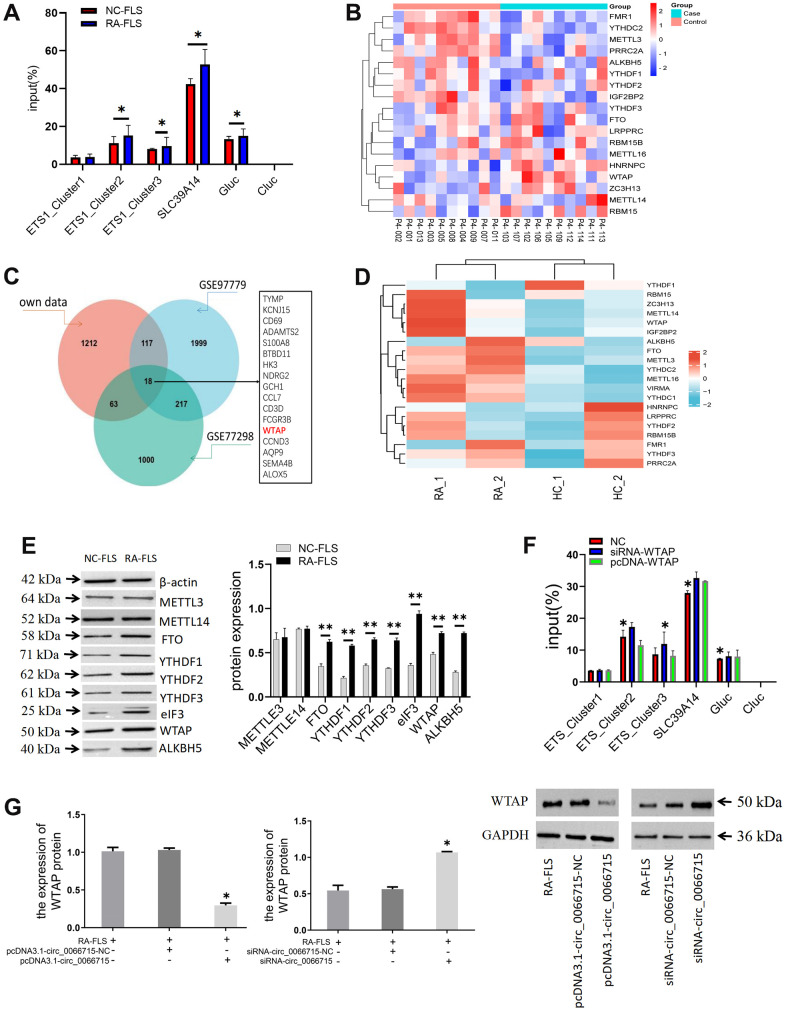
The effect of ETS1 m6A methylation modification on macrophage polarization. (A) Analysis of m6A methylation modification sites and ETS1-m6A-qPCR.*P < 0.05. (n=3, paired t-test). (B) Heatmap of genes associated with m6A RNA methylation. (C) Venn diagram of methylation-related genes in the dataset. (D) Analysis of the mRNA expression of the main modification enzymes of m6A RNA methylation. (E) m6A methylase protein expression in co-cultured cells by western blotting. **P < 0.01, vs NC-FLS. (n=3, paired t-test). (F) ETS1 methylation expression after WTAP intervention. **P < 0.01, *P < 0.05, vs NC. (n=3, paired t-test). (G) The effect of circ_0066715 on WTAP. *P<0.05. (n=3, ANOVA with Bonferroni’s post test).

