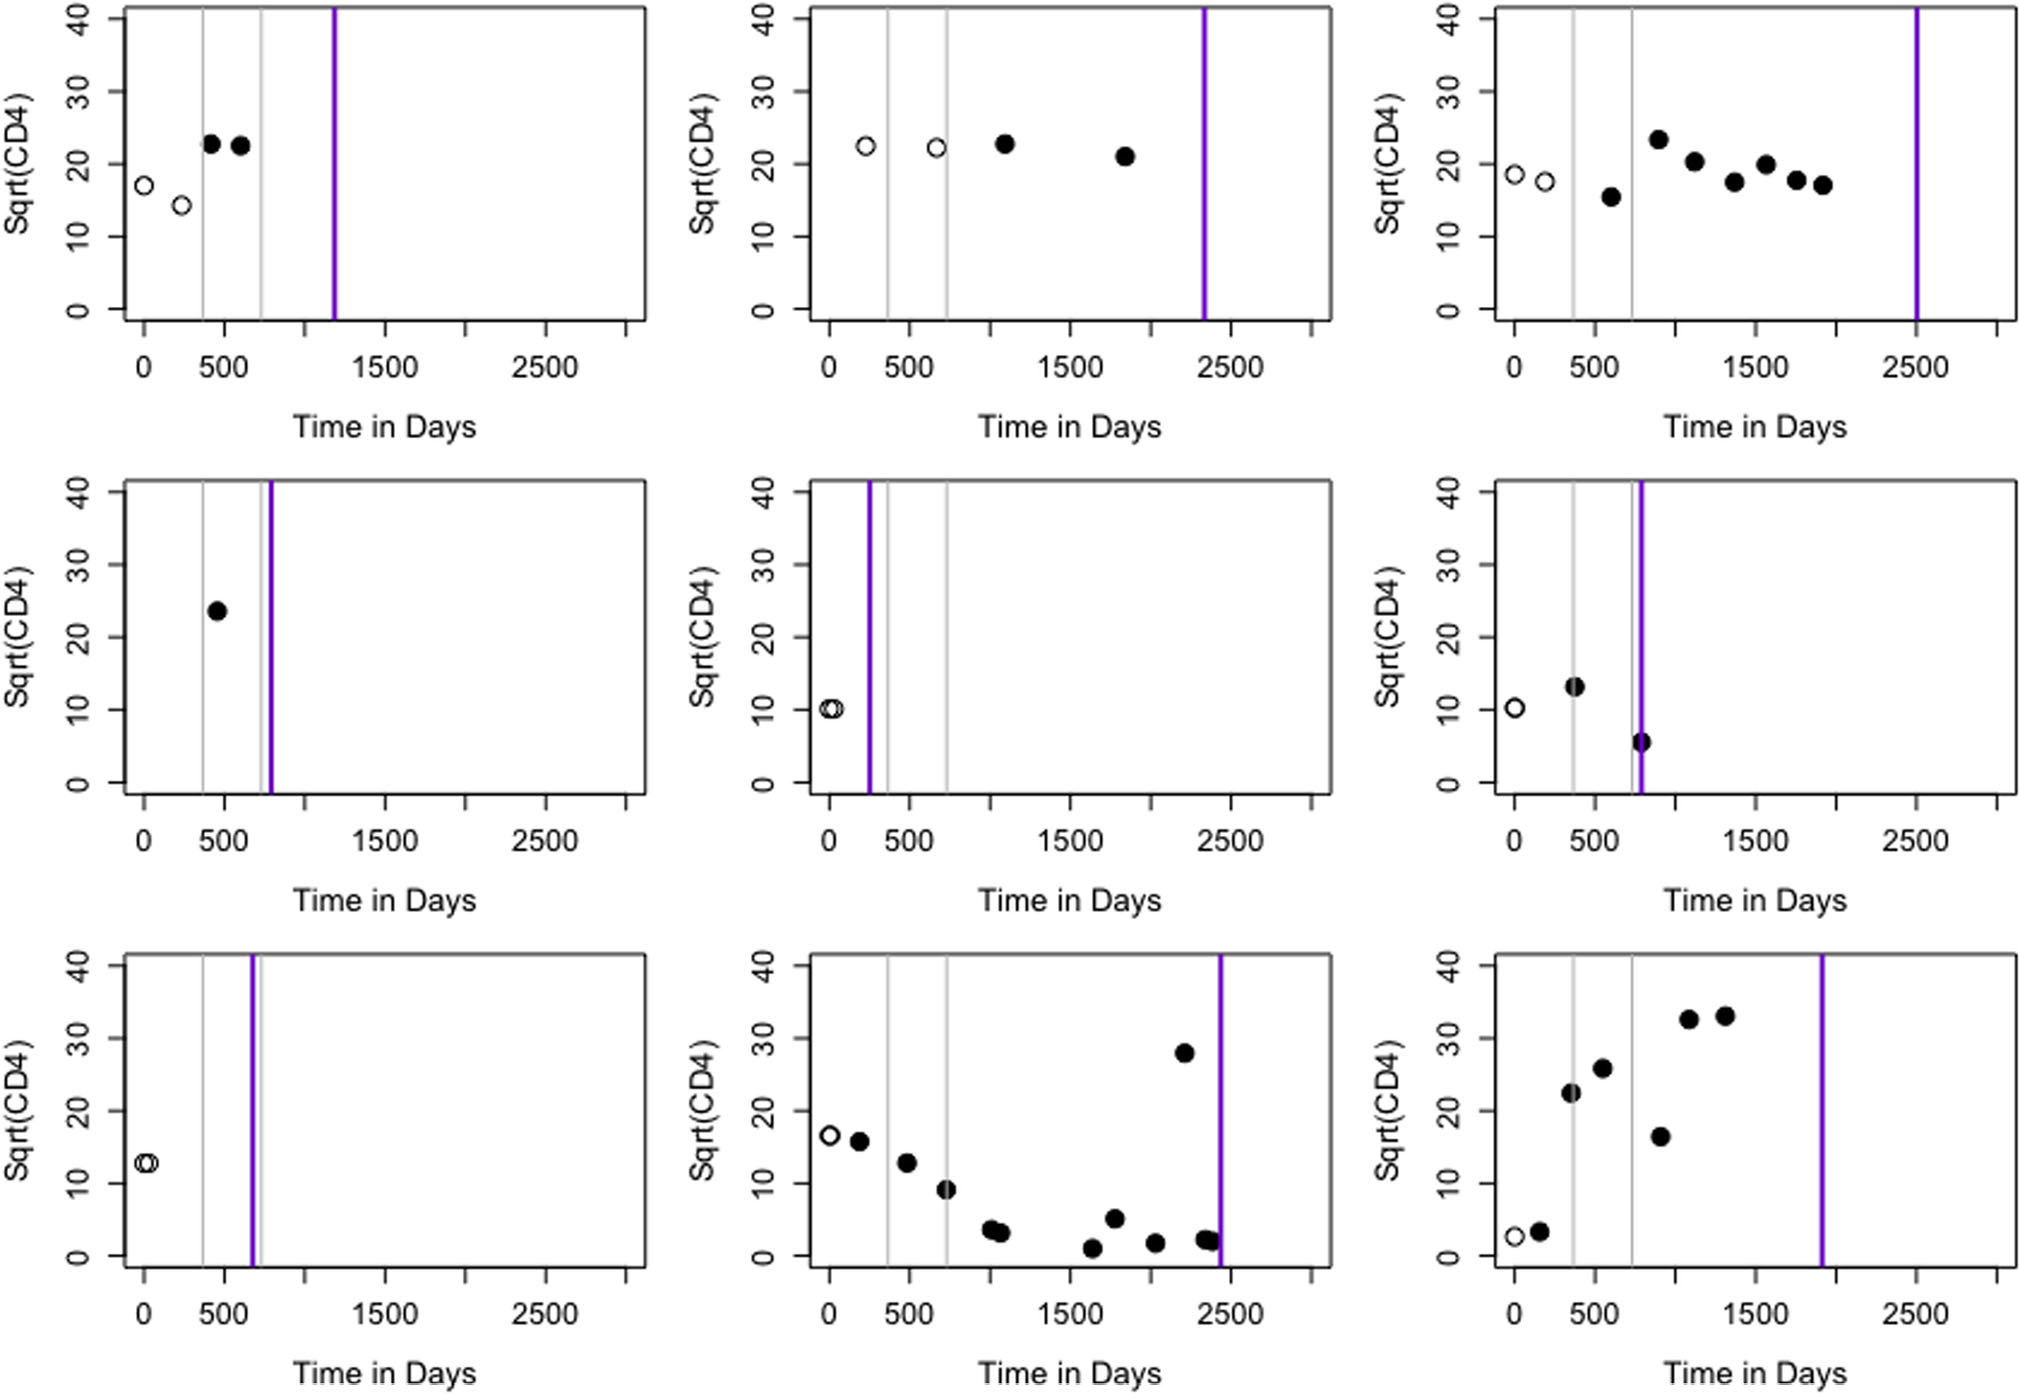
FIGURE 1.

CD4 and ART initiation status during follow-up for nine randomly selected individuals. Empty circles indicate no ART and filled circles represent on ART. Two gray lines denote 1 and 2 years postdiagnosis. Purple line corresponds to end of follow-up. ART, antiretroviral therapy
