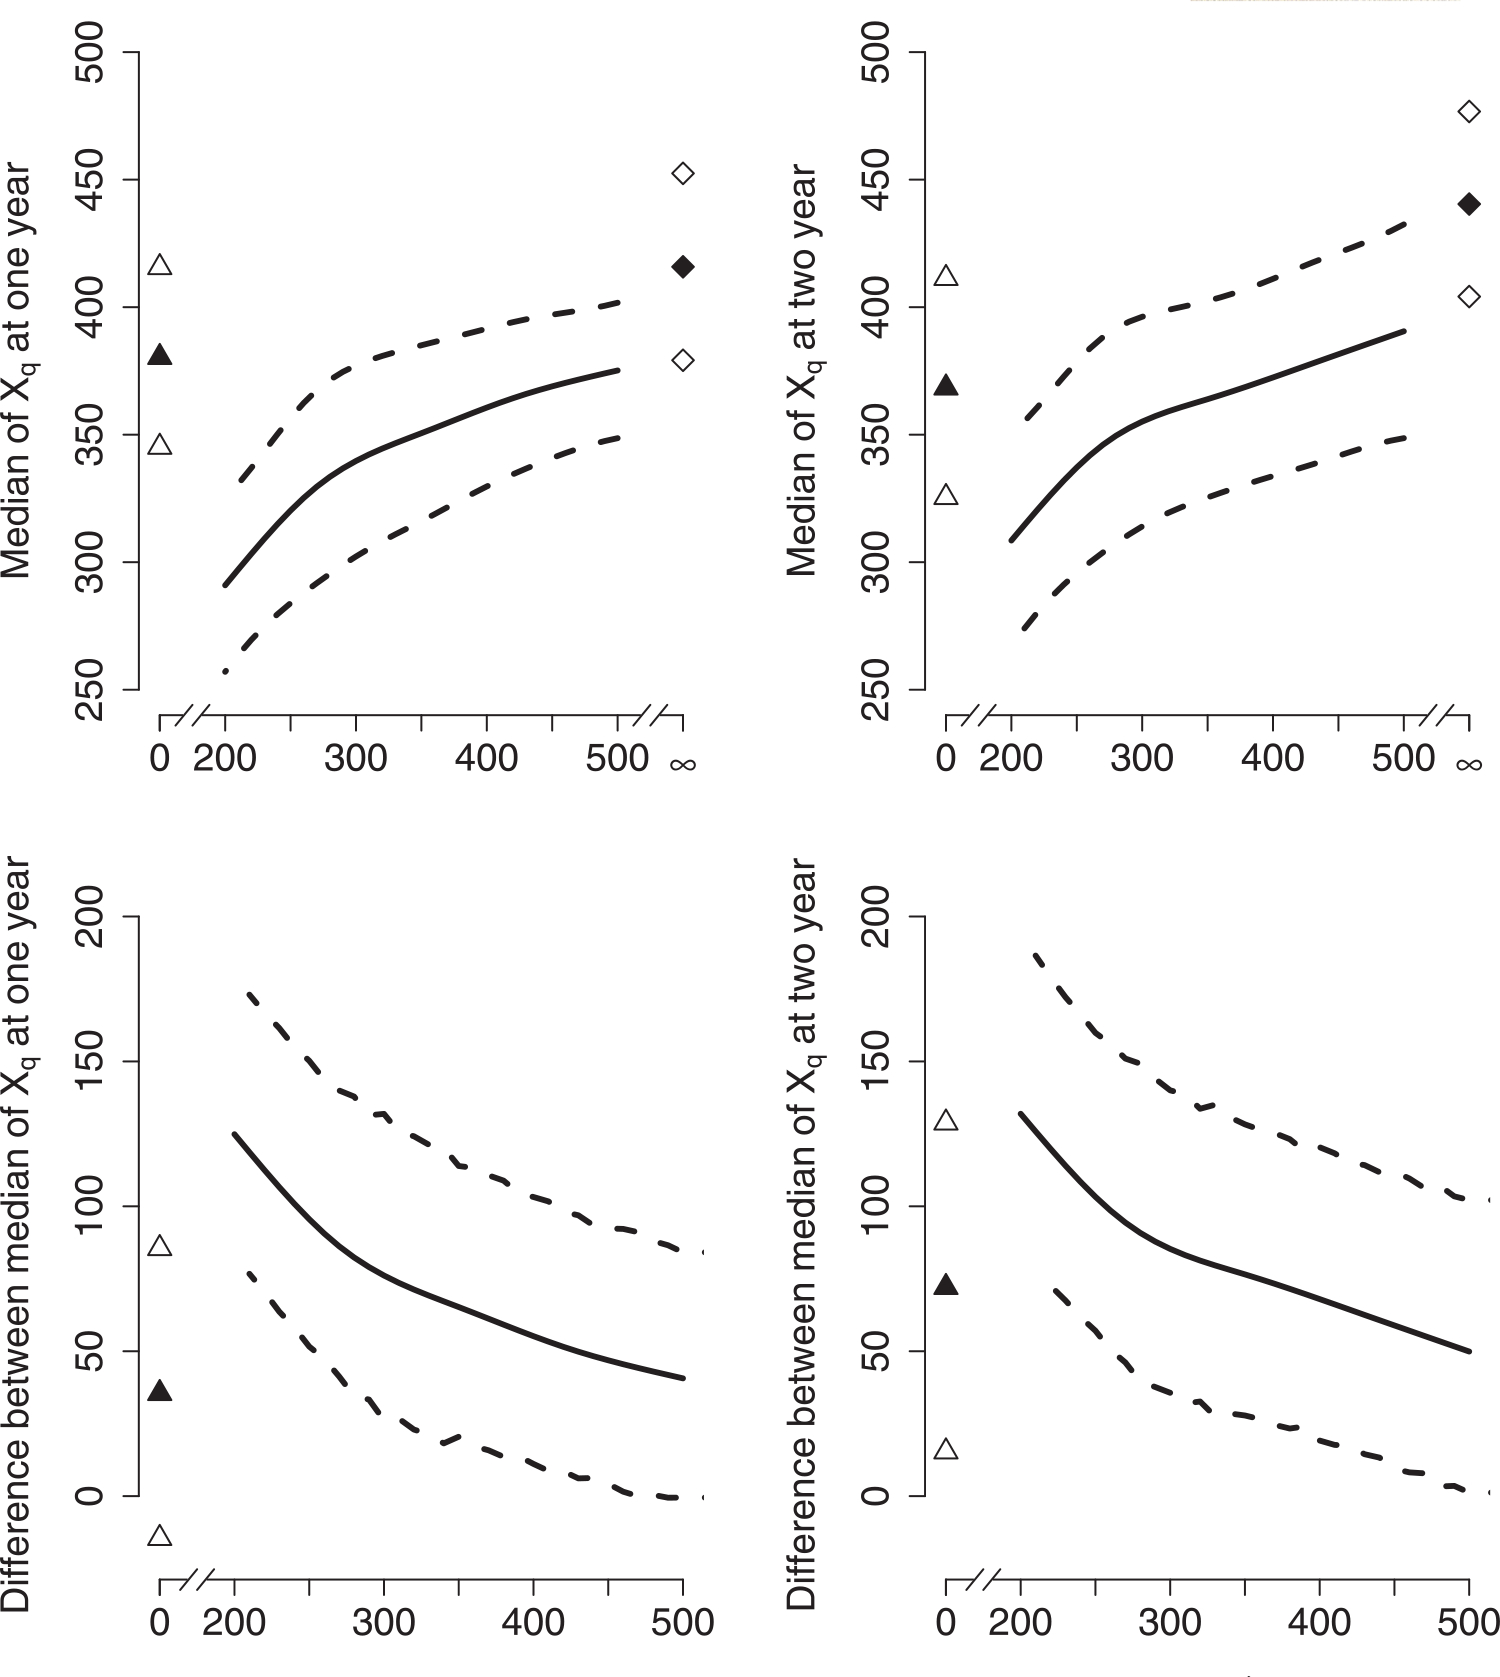
FIGURE 3.

The effectiveness of continuous regimes. The upper panel presents the median of Xq, , at 1 and 2 years; the bottom panel displays the difference in at 1 and 2 years between regimes q = ∞ and q ∈ {0, 200, 210,…,500}. The triangles represent corresponding to regime q = 0 (upper panel), and the difference in between regimes q = ∞ and q = 0 (bottom panel). Similarly, the diamonds correspond to under regime q = ∞. The filled symbols are the mean values, and the empty symbols are the upper and lower bounds of the 95% confidence intervals
