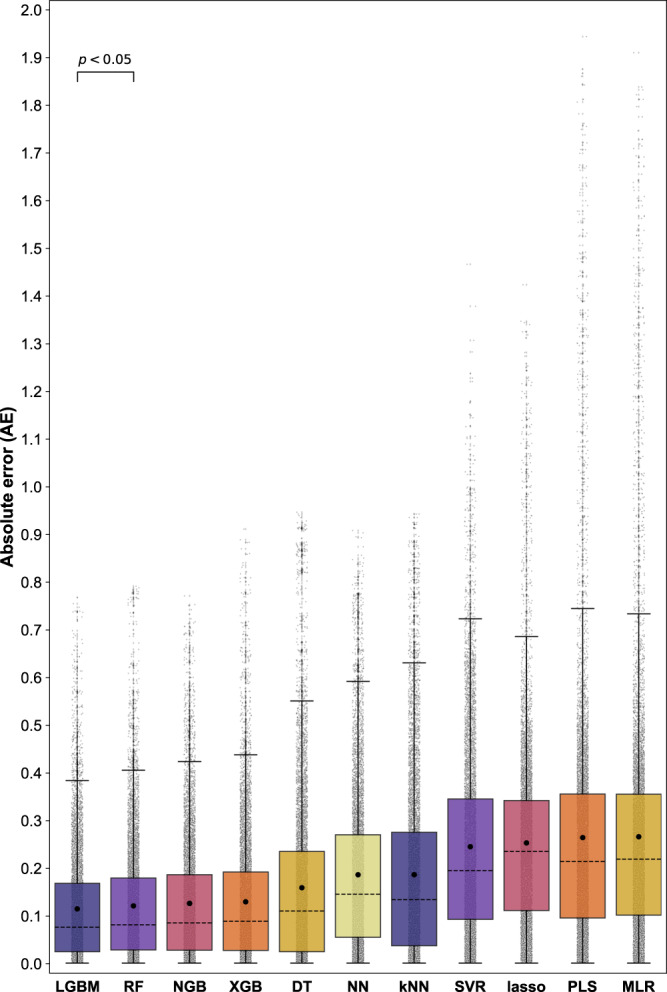
Fig. 2. Summary of the overall predictive performance of the various ML models represented as a box and whisker plot.

The data represent the absolute error (AE) obtained for fractional drug release predictions during nested cross-validation (i.e., n = 10 trials). Each column represents the AE value for 8013 data instances from the collective nested cross-validation test sets (light gray circles). The mean absolute error (MAE) and median AE values for each model are displayed within the boxes as closed black circles, and black dashed lines, respectively. The first and second quartiles are shown by the upper and lower edges of the respective boxes. The whiskers extend to show the rest of the distribution, excluding points determined to be “outliers” using the interquartile range method. Source data are provided as a Source Data file.
