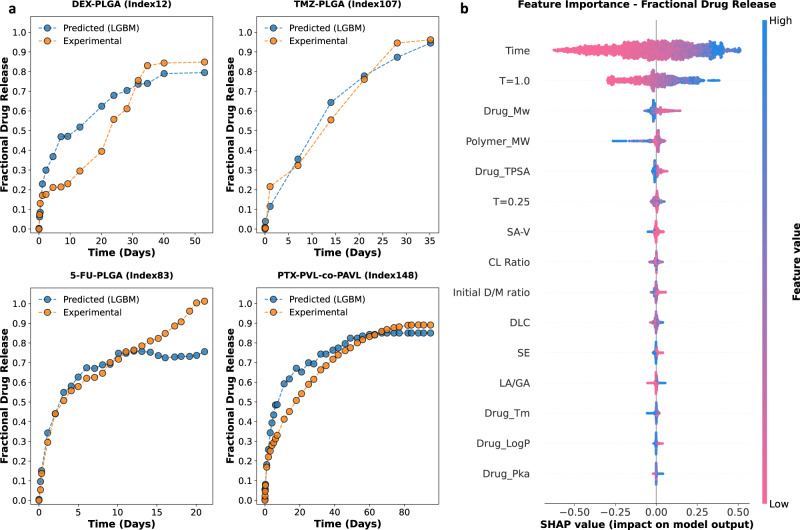
Fig. 4. Deployment of the trained 15-feature lightGBM (LGBM) model.
a Select examples of experimental fractional drug release profiles (orange circles) in comparison to predicted fractional drug release profiles (blue circles) generated by the LGBM model. These include dexamethasone-loaded PLGA MPs (DEX-PLGA); temozolomide-loaded PLGA MPs (TMZ-PLGA); fluorouracil-loaded PLGA MPs (5-FU-PLGA); and paclitaxel-loaded PVL-co-PAVL cross-linked cylinders. b Shapley additive explanations (SHAP) analysis for the 15-feature LGBM model. The impact of each feature on fractional drug release is illustrated through a swarm plot of their corresponding SHAP values. The color of the dot represents the relative value of the feature in the dataset (high-to-low depicted as pink-to-blue). The horizontal location of the dots shows whether the effect of that feature value contributed positively or negatively in that prediction instance (x-axis). Source data are provided as a Source Data file.

