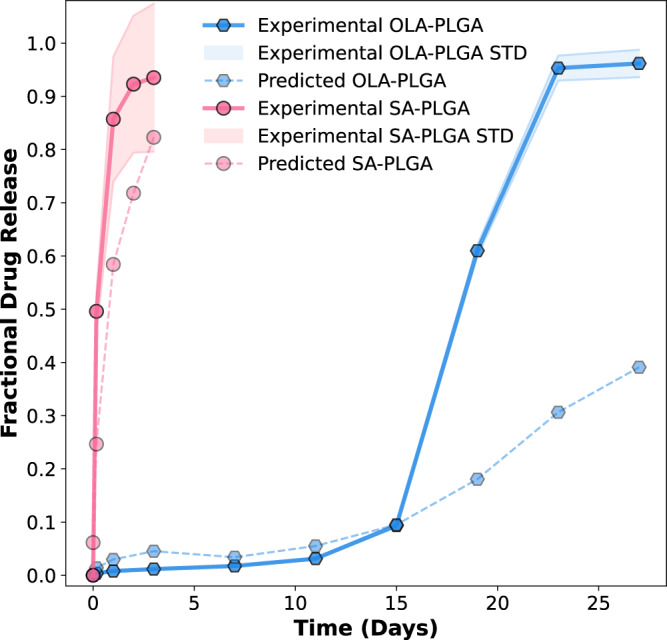
Fig. 7. Comparison of the experimental and predicted fractional drug release profiles for the salicylic acid-PLGA MP (SA-PLGA) and olaparib-PLGA MP (OLA-PLGA) formulations.

The design of both the SA-PLGA and OLA-PLGA was based on SHAP analysis of the trained LGBM model. Three independent batches of both formulations were prepared, and their experimental drug release was characterized in 0.5 wt% sodium dodecyl sulfate (SDS) to ensure sink conditions throughout the experiments. The fractional experimental drug release profiles for SA-PLGA and OLA-PLGA are plotted together as pink circles with a solid line (SA-PLGA) and blue hexagons with a solid line (OLA-PLGA), respectively. In both cases, the standard deviation (STD) observed for these experimental drug release measurements is displayed as a colored halo (n = 3). The fractional drug release profiles predicted by the LGBM model are also shown as pale pink circles with a broken line (SA-PLGA) and pale blue hexagons with a broken line (OLA-PLGA), respectively. Source data are provided as a Source Data file.
