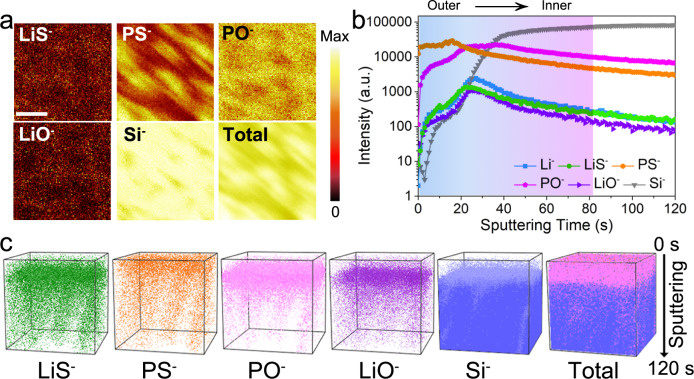
Fig. 4. Chemical compositions of the gradient oxy-thiophosphate thin film.
a TOF-SIMS secondary ion images of LiS-, PS-, PO-, LiO-, and Si- species after Cs+ consecutive sputtering for 120 s (the length of scale bar is 40 μm) for the PS-LPO-Si sample. b Depth profile of various secondary ion species obtained by sputtering. c The 3D view images of the sputtered volume corresponding to the depth profiles in (a) show the gradient oxy-thiophosphate distribution. The analysis area is 75 × 75 μm2.

