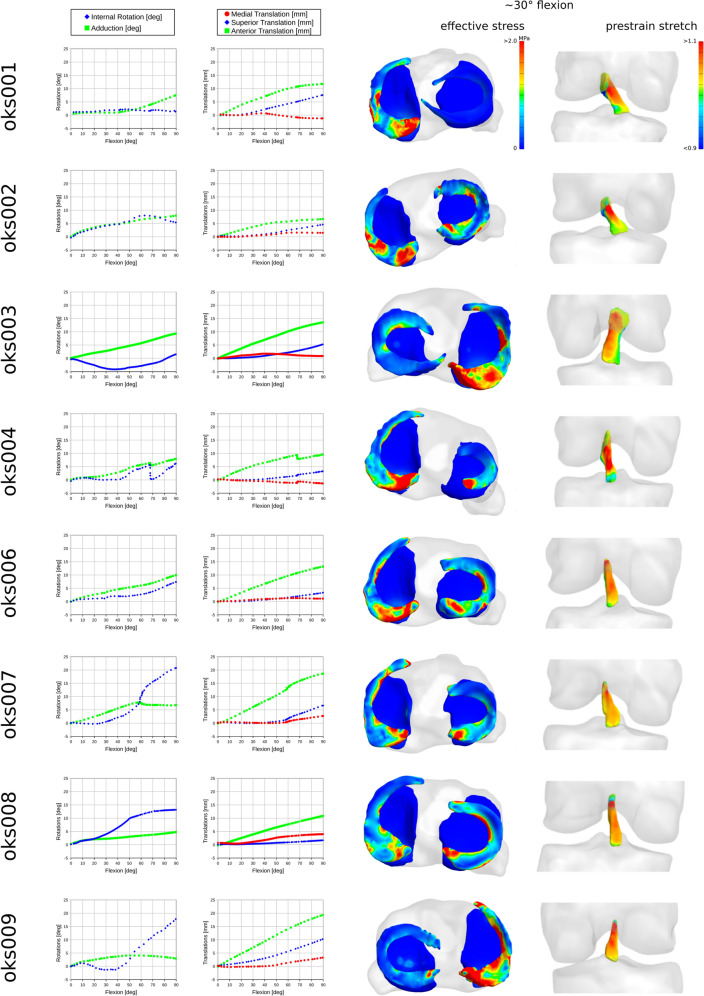
Figure 4.
Joint movements and tissue mechanics during passive flexion, obtained by demonstrative finite element analyses of the knee models. From left to right, tibiofemoral joint rotations and translations (joint connector degrees of freedom), effective stress distributions on menisci and tibial cartilage and menisci (at ~ 30° flexion angle), and prestrain stretch (corresponding to total fiber stretch) distributions in anterior cruciate ligament (at ~ 30° flexion angle) are shown for each knee.

