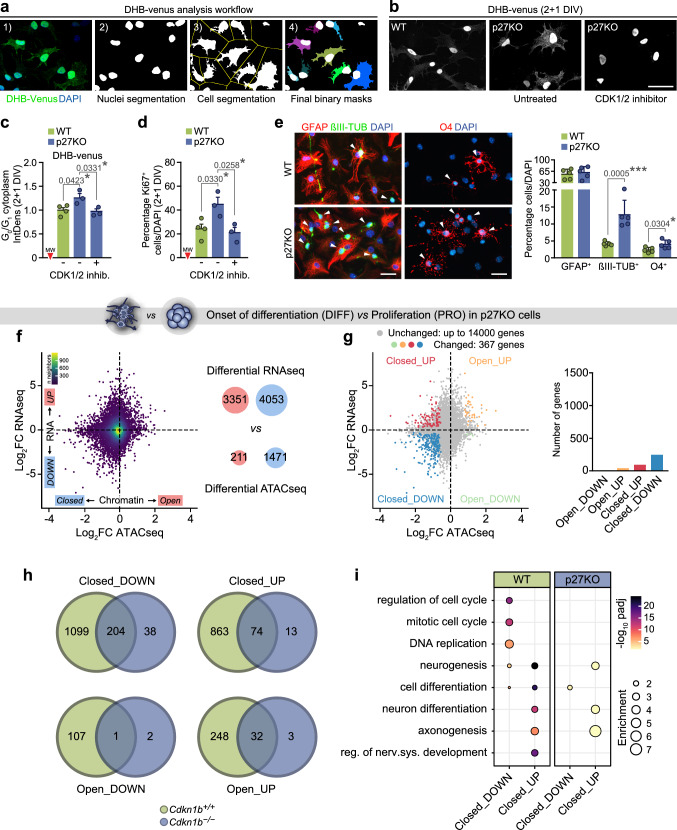
Fig. 2.
Cell cycling and cell fate decisions in adult NPC cultures are regulated by p27. a Main steps during DHB-mVenus bioimage analysis workflow (see “Materials and methods”). b, c DHB-mVenus signal (white) in WT and p27KO cultures at 2 + 1 DIV after CDK1/2 inhibitor treatment. Comparison of cytosolic gray integrated density (IntDens) of DHB-mVenus fluorescence of cells in G0/G1 measured by Bioimage Analysis. WT and p27-deficient cultures, either untreated or treated with 1 µM CDK1/2 inhibitor were imaged and scored as fold change relative to WT at 2 + 1 DIV. d Percentage of Ki67+ cells at 2 + 1 DIV in WT, p27KO and mutant cultures treated with 1 µM CDK1/2 inhibitor. e Immunocytochemistry (left) and quantification (right) of βIII-TUBULIN+ neurons (green), GFAP+ astrocytes (red) and O4+ oligodendrocytes at 2 + 5 DIV (left) in WT and p27KO cultures. Arrowheads point out positive cells. DAPI was used to counterstain nuclei. f, g Scatterplot and histogram as in Fig. 1b, c describing differentiation in p27KO cells. h Venn diagrams comparing the number of genes with simultaneous changes in chromatin and expression in wild-type and p27KO cells. i Dot plot representation of the functional enrichment analysis of the genes in the overlapping regions shown in h. Graphs represent mean and all error bars show s.e.m. The number of independent biological samples is indicated as dots in the graphs. *p < 0.05; **p < 0.01; ***p < 0.001. Scale bars: 30 µm

