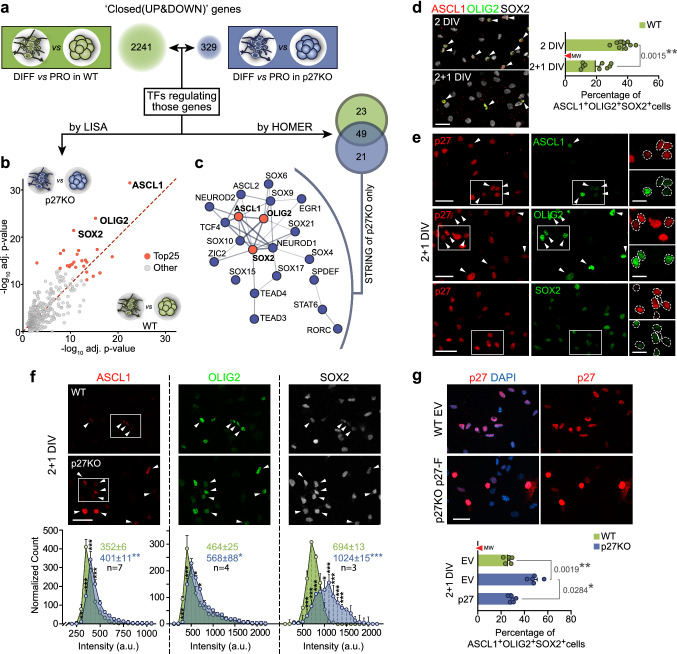
Fig. 3.
Deregulation of SOX2, ASCL1 and OLIG2 TFs in p27KO cultures at the onset of differentiation. a Schematic drawing of the integrative genomic analysis of RNA-seq and ATAC-seq datasets of differentiating vs proliferating wild-type cells (green) and p27KO cells (blue). Numbers in bubbles indicate the amount of UP and DOWN-regulated genes with decreased promoter chromatin accessibility. b Comparison of both gene lists with LISA to search for TFs that might be involved in their regulation. The scatterplot shows the statistical significance of TF with each of the gene lists. c HOMER search for TF binding motifs in the promoters of genes in both lists. The Venn diagram shows the statistically significant (FDR < 0.05) binding sites found for each comparison. The STRING interaction network shows the 21 TFs with binding sites at the promoters of genes associated with proliferation-to-differentiation transition in p27KO cells. d Immunocytochemistry for ASCL1 (red), OLIG2 (green) and SOX2 (white) in WT cultures at 2 and 2 + 1DIV (left) and quantification of the percentage of triple-positive cells in the culture (right). e Immunocytochemistry for p27 (red) in combination with ASCL1, OLIG2 or SOX2 (green) in 2 + 1DIV NPCs. f Immunocytochemistry for ASCL1 (red), OLIG2 (green) and SOX2 (white) in 2 + 1DIV WT and p27KO NPCs (top panels). Quantification showing the expression distribution of each TF as a result of p27 deficiency. Colored numbers are the median intensity of each genotype (bottom panels). g Immunostaining for p27 (red) in WT cultures transfected with an empty vector (EV) and p27KO cultures overexpressing a full-length p27 construct (p27-Flag) (2 + 1 DIV) (top panel). Quantification of the percentage of ASCL1+OLIG2+SOX2+ cells at 2 + 1 in WT and p27KO cultures either transfected with an empty vector (EV) or with a full-length p27 construct. The number of independent biological samples is indicated as dots in the graphs. Graphs represent mean and all error bars show s.e.m. Exact p values are indicated in the graphs and legend, being *p < 0.05; **p < 0.01; ***p < 0.001. Scale bars: 30 µm (inserts in d: 15 µm)

