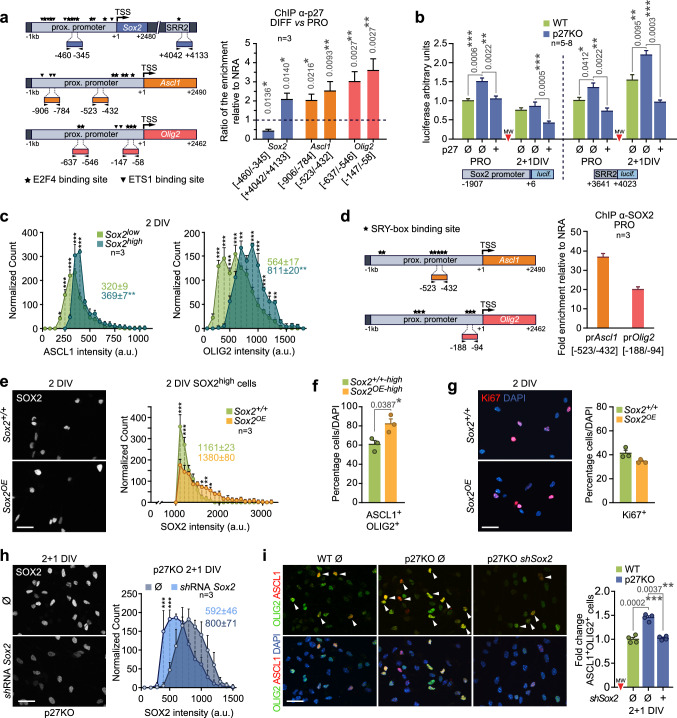
Fig. 4.
Direct and indirect regulation of Sox2, Ascl1 and Olig2 genes by p27. a Schematic drawing of Sox2, Ascl1 and Olig2 genes and amplicons used in the p27ChIP protocol. TSS transcription start site. Stars: putative E2F4 binding sites. Inverted triangles: putative ETS1 binding sites (left panel). Anti-p27 ChIP assay in differentiative (DIFF, 2 + 1 DIV) relative to proliferative (PRO, spheres) conditions. Binding to the Sox2 promoter and enhancer regions and to the Ascl1 and Olig2 proximal promoters is represented as the ratio of enrichment normalized to a non-related antibody (NRA) (right panel). b Luciferase reporter assay in PRO and DIFF conditions in WT, p27KO cultures and p27KO cells transfected with a full-length p27 construct. Transcription activity is represented as arbitrary units relative to WT during proliferation. c Frequency histograms showing ASCL1 and OLIG2 levels among SOX2low and SOX2high populations at 2 DIV of differentiation. Colored numbers are the median intensity of each population. d Schematic drawing of Ascl1 and Olig2 genes and amplicons used in the SOX2 ChIP protocol. Stars: putative binding sites for the SOX family (SRY box bs) (left panel). Anti-SOX2 ChIP assay during proliferation. Binding is represented as fold enrichment relative to a non-related antibody (NRA) (right panel). e Immunocytochemistry showing SOX2 expression (white) after Sox2 overexpression at 2 DIV (left panel). Histogram showing SOX2 levels in the 30% brightest cells (SOX2high) of WT and overexpressing (Sox2OE) cultures at 2 DIV. Colored numbers indicate the median intensity (right panel). f Percentage of ASCL1+OLIG2+ cells among the SOX2high population during 2 DIV of differentiation of WT (Sox2+/+−high) and SOX2 overexpressing cultures (Sox2OE−high). g Representative images and quantification of the percentage of Ki67+ progenitors at 2 DIV after SOX2 overexpression (p value = 0.1552). h Immunocytochemistry showing SOX2 expression (white) (left panel) and the corresponding quantification (right panel) in p27KO cultures after Sox2 downregulation by shRNASox2 at 2 + 1 DIV. Colored numbers indicate the median intensity (p value = 0.0604). i Representative images (left) and quantification (right) of the ASCL1+OLIG2+ population at 2 + 1 DIV after transfection with a shRNASox2 in p27-deficient cells. An empty vector (Ø) was used as a negative control. Data are represented as fold change relative to WT. Graphs represent mean and all error bars show s.e.m. The number of independent biological samples is indicated as dots in the graphs. Exact p values are indicated in the graphs and legend, being *p < 0.05; **p < 0.01; ***p < 0.001. Scale bars: 30 µm

