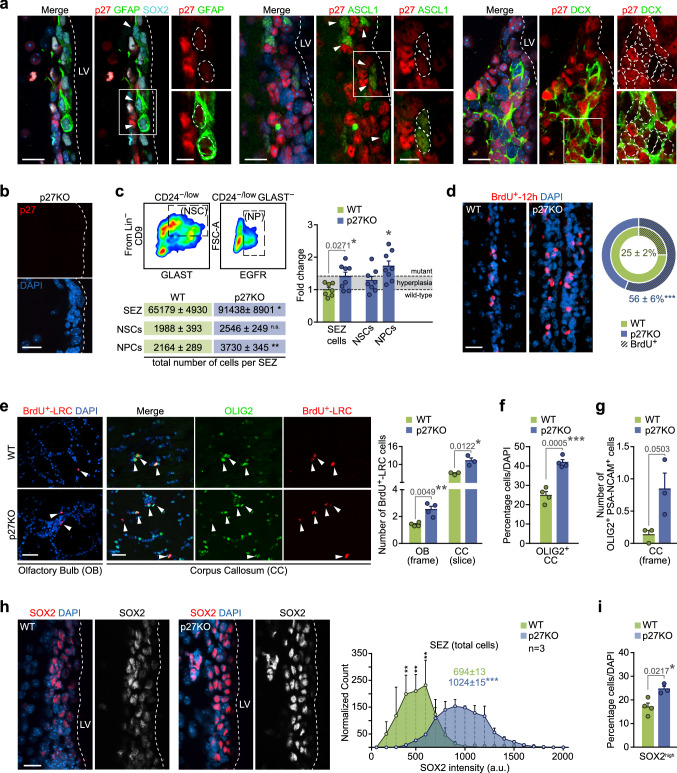
Fig. 5.
p27 determines the rate of NPC-sustained neurogenesis and oligodendrogenesis in the adult SEZ. a Immunohistochemistry showing expression of p27 (red) in GFAP+(green)/SOX2+ (cyan) NSCs, ASCL1+ (green) NPCs and DCX+ (green) NBs in the SEZ of WT mice. b Immunohistochemistry for p27 (red) in the SEZ of p27KO mice. c Representative FACS plots showing GLAST and CD9 staining of Lin− CD24−/low fraction. NSCs are identified by CD9high levels in the GLAST+ cells while the Lin− CD24−/low GLAST− region contains EGFR+ NPCs (top left panel). Total number of NSCs (p value = 0.2400) and NPCs (p value = 0.0046) analyzed by FACS in the SEZ as fold change of p27KO relative to WT mice (bottom left panel) (NSCs: n.s., p value = 0.5585; NPCs: p value = 0.0432). Dashed line represents the observed increment in p27KO number of cells owing to general hyperplasia (right panel). d Immunohistochemistry for BrdU (red) within the SEZ of WT and p27KO mice. Percentage of cells that incorporated BrdU in the 12 h prior to euthanasia (BrdU+-12 h) in each genotype. e Immunohistochemistry showing the staining of BrdU-LRC (red) in the glomerular layer of the olfactory bulb (OB), and of BrdU-LRC (red) and OLIG2 (green) in the corpus callosum (CC) of WT and p27KO mice. Arrowheads indicate double-positive cells (left panel). Quantification of the number of BrdU-LRC cells in the OB and CC of wild-type and p27-deficient mice (right panel). f Percentage of OLIG2+ oligodendrocytes in the CC of WT and p27KO adult brains. g Quantification of the number of PSA-NCAM+OLIG2+ cells per frame in the CC of WT and p27KO mice. h Immunohistochemistry showing the expression of SOX2 (red and white) in the SEZ of WT and p27-deficient mice (left panel). Histogram showing quantification of SOX2 intensity. Colored numbers are the median intensity of each population (right panel). i Percentage of cells that express high levels of SOX2 in the SEZ of WT and p27-deficient mice. DAPI was used to counterstain nuclei. LV lateral ventricle. Graphs represent mean and all error bars show s.e.m. The number of independent biological samples is indicated as dots in the graphs. Exact p values are indicated in the graphs and legend, being *p < 0.05; **p < 0.01; ***p < 0.001. Scale bars: a, b, h, 20 µm (inserts 10 µm); d, e, 30 µm

