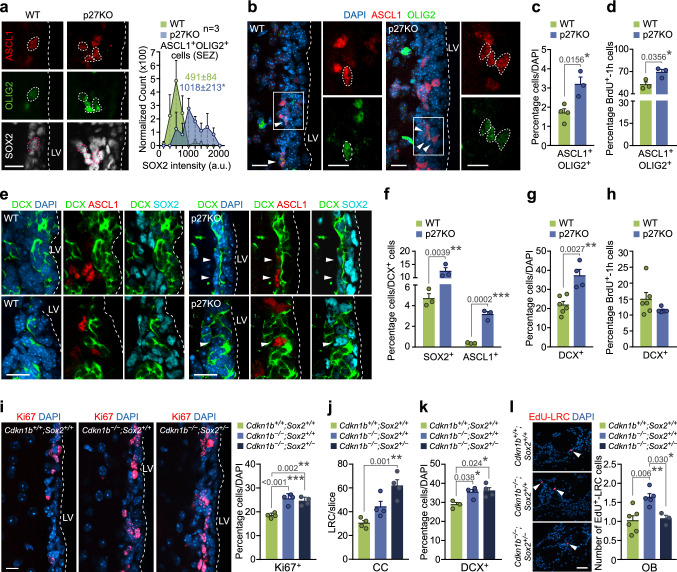
Fig. 6.
p27-dependent levels of SOX2 regulates timely cell cycle exit in adult neurogenesis and oligodendrogenesis. a Representative immunohistochemistry images for ASCL1 (red) and OLIG2 (green) and SOX2 (white) in the SEZ of WT and p27KO mice. Triple-positive cells are delineated (left). Quantification of SOX2 expression intensity in ASCL1+OLIG2+ cells in the SEZ of WT and p27KO mice (right). b Representative immunohistochemistry images for ASCL1 (red) and OLIG2 (green) in the SEZ of WT and p27KO mice. Arrowheads indicate double-positive cells. c Percentage of ASCL1+OLIG2+ cells in the SEZ of adult WT and p27KO mice. d Percentage of proliferating cells (BrdU-1h+) among the ASCL1+OLIG2+ population as a result of p27 deficiency. (e) Immunohistochemistry showing expression of ASCL1 (red), DCX (green) and SOX2 (cyan) in the SEZ of WT and p27KO mice. Arrowheads indicate triple-positive cells. f Quantification of the percentage of DCX+ NBs that are positive for SOX2 or ASCL1 in the SEZ of WT and p27KO mice. g Percentage of DCX+ NBs produced in the adult SEZ. h Percentage of proliferating cells (BrdU-1h+) among the DCX+ p27-mutant population. i Immunohistochemistry for Ki67 (red) in the adult SEZ of WT, p27KO (Cdkn1b−/−;Sox2+/+) and p27-deficient, Sox2 heterozygous (Cdkn1b−/−;Sox2+/−) mice (left panel). Percentage of Ki67+ cells (p value = 0.0004 by one-way ANOVA) (right panel). j Number of EdU-LRC cells in the CC of Cdkn1b+/+;Sox2+/+, Cdkn1b−/−;Sox2+/+ and Cdkn1b−/−;Sox2+/− mice (p value = 0.002 by one-way ANOVA). k Percentage of DCX+ cells in the SEZ of Cdkn1b+/+;Sox2+/+, Cdkn1b−/−;Sox2+/+ and Cdkn1b−/−;Sox2+/− mice (p value = 0.020 by one-way ANOVA). l Immunohistochemistry and quantification of the number of BrdU-LRC (red) reaching the glomerular layer of the OB of Cdkn1b+/+;Sox2+/+, Cdkn1b−/−;Sox2+/+ and Cdkn1b−/−;Sox2+/− mice (p value = 0.005 by one-way ANOVA) DAPI was used to counterstain nuclei. LV lateral ventricle. Graphs represent mean and all error bars show s.e.m. The number of independent biological samples is indicated as dots in the graphs. Exact p values are indicated in the graphs and legend, being *p < 0.05; **p < 0.01; ***p < 0.001. Scale bars: a, e, i 20 µm (inserts 10 µm); l 30 µm

