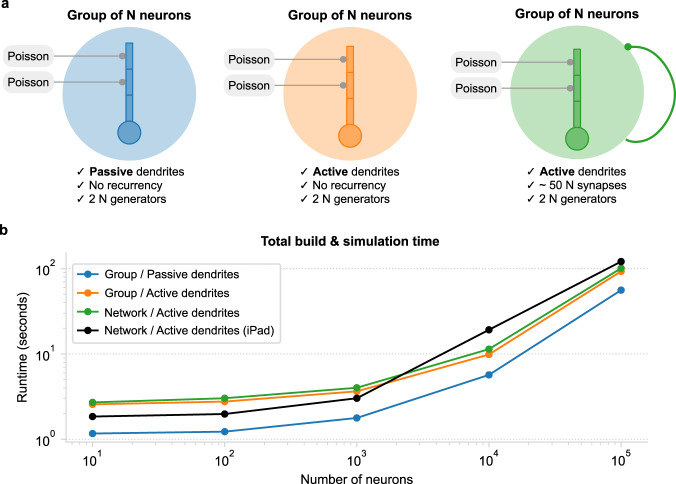
Fig. 6. Estimating Dendrify’s performance for increasing network complexity and size.
a Schematic illustration of the three model cases used for the scalability analysis. In all cases, the neuronal model was an adapted version of the four-compartment model shown in Fig. 2a. Note that the number of Poisson input generators scaled with N. Left: a group of N neurons with passive dendrites and no recurrent synapses. Middle: a group of N neurons with active dendrites (i.e., furnished with Na+ dSpikes) and no recurrent synapses. Right: a recurrent network of N neurons with active dendrites and ~50 synapses/neuron. b Scalability plots, showing how the combined build and simulation time scales when increasing N. The times plotted here represent the average of 10 runs. Simulations were performed on a laptop (blue, orange, and green) or an iPad (black). For more information, refer to Supplementary Table 4. All scalability codes and the raw results are available on GitHub.

