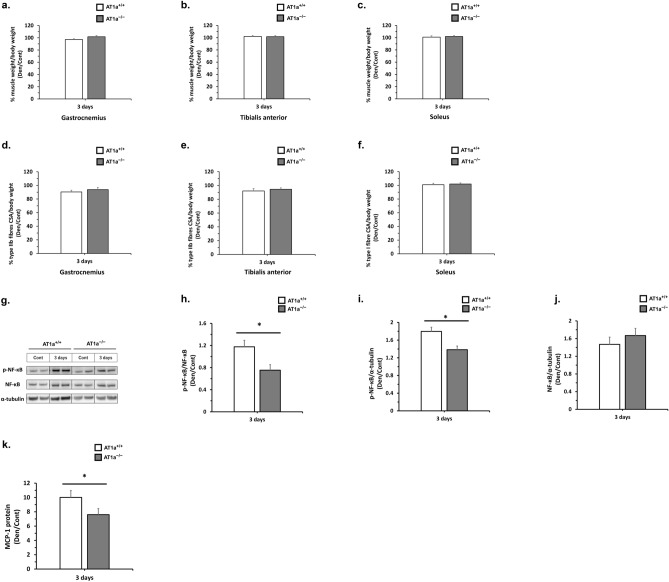
Figure 7.
Evaluation of muscle wasting at 3 days postdenervation. (a–c) Change in skeletal muscle weight normalized to the body weight in denervated gastrocnemius (a), tibial anterior (b), and soleus (c) muscles at 3 days postdenervation. The graphs show the fold increase or decrease in each normalized muscle weight in the Den group compared with the Cont group. (d–f) Quantitative analysis of cross-sectional areas of type IIb and type I muscle fibers normalized to the body weight in gastrocnemius (d), tibial anterior (e), and soleus muscle (f) in the Den group compared with the Cont group at 3 days postdenervation. The graphs show the fold decrease in each cross-sectional area normalized to body weight in the Den group compared to the Cont group. (g–j) Protein expression levels of phosphorylated NF-κB and total NF-κB were evaluated by western blot analysis. Expression levels in each sample were normalized to α-tubulin expression levels and were shown as the fold increase or decrease in protein expression in the Den group compared with the Cont group. Relative protein expression was calculated for p-NF-κB/NF-κB (h), p-NF-κB/α-tubulin (i), and NF-κB/α-tubulin (j). Samples from the same experiment were processed in parallel for SDS-PAGE and western blotting using different gels and membranes, and the image data obtained were cropped. Entire images of western blotting are shown in online supplementary resource Supplementary Fig. S6. (k) Protein expression levels of MCP-1 were measured by ELISA. The graphs show the fold increase or decrease in protein concentration levels in the Den group compared with the Cont group. The protein concentrations of MCP-1 in each sample were normalized to total protein levels. The graph shows the fold increase in normalized MCP-1 protein in the Den group compared with the Cont group. AT1a+/+-Cont group, n = 9; AT1a+/+-Den group, n = 9; AT1a−/−-Cont group, n = 9; AT1a−/−-Den group, n = 10. Values are means ± SE. *P < 0.05.

