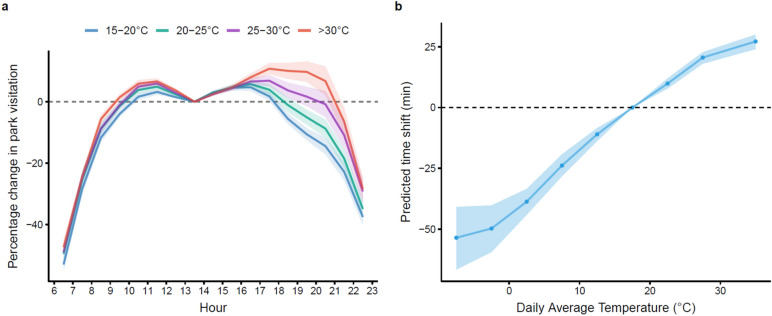
Figure 4.
Quantification of temperature-driven time shift. (a) Within-day hourly activity distribution by daily average temperature range. Each line represents the within-day activity pattern for days lying in each daily average temperature range. Shaded areas are 95% confidence intervals. (b) Quantified time shift (Δt) as a function of daily average temperature. Shaded areas are 95% confidence intervals calculated through Monte Carlo sampling of econometric parameter estimates of both the within-day activity distribution pattern (25 quantiles) and the daily activity quantity by temperature (25 quantiles)54.

