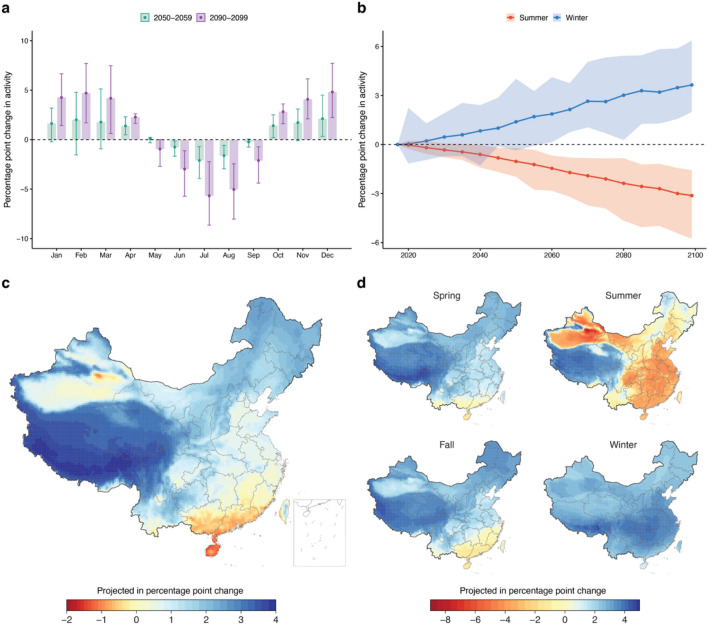
Figure 5.
Projected change in park visitation quantity. (a) Additional percentage point change in park visitation quantity by month in the years 2050 and 2099 compared with 2017 due to climate change. (b) The percentage change in activity quantity for summer and winter respective for all years in the future. Geographic estimates of the projected change in park visitation quantity in all areas of China in 2090–2099 under the RCP8.5 scenario. Error bars and shaded areas represent 95% confidence intervals calculated through Monte Carlo sampling of econometric parameter estimates and climate models. (c) Geographic dispersion of the predicted additional yearly average effects of climate change-induced activity change in 2090–2099. (d) Prediction of additional climate change-induced activity change in 2090–2099 by seasons. Results for the RCP 4.5 scenario are presented in Supplementary Fig. 6. The figure was created using R (version 4.1.0 https://www.r-project.org/), and the maps do not have a copyright dispute.

