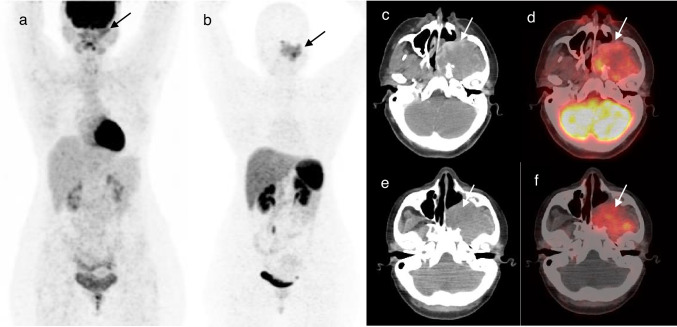
Fig. 2.
Maximum intensity projection (MIP) images showing metabolically active mass (arrow) in the left maxillary region on F-18 FDG PET-CT (a) which shows tracer avidity (arrow) on Ga-68 DOTANOC PET-CT (b). Axial CT (c) and axial fused PET-CT (d) images of F-18 FDG PET-CT showing a metabolically active heterogeneously enhancing mass (arrows) involving the left maxillary sinus and left infratemporal fossa. Axial CT (e) and axial fused PET-CT (f) images of Ga-68 DOTANOC PET-CT showing the same mass (arrows) with tracer avidity

