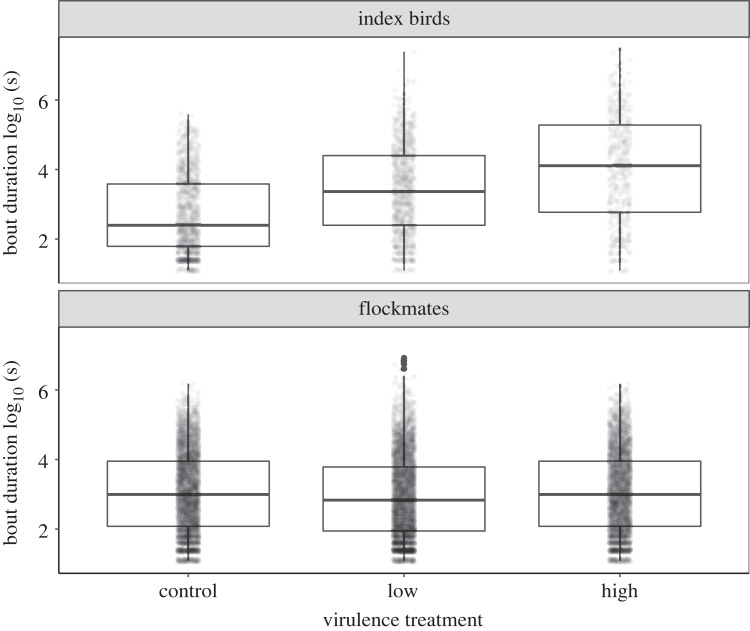
Figure 4.
Index house finches (n = 9) inoculated with one of three treatments (control, low-virulence strain, or high-virulence strain of M. gallisepticum) varied significantly in the duration of feeding bouts (log10 s) at peak infection (top panel). By contrast, there were no differences in bout duration among untreated flockmates (n = 34 birds across 9 flocks) during the same time period (bottom panel). Each data point (jittered for visualization) represents a single unique foraging bout detected via Radio Frequency Identification Device (see Methods); non-independence in repeated bouts was controlled for by including bird ID as random effect. Untransformed data were analysed with a log-link function in a GLMM but are shown here log-10 transformed for ease of visualization. Box plots represent the median (dark line), 25% quartile (lower line) and 75% quartile (upper line).

