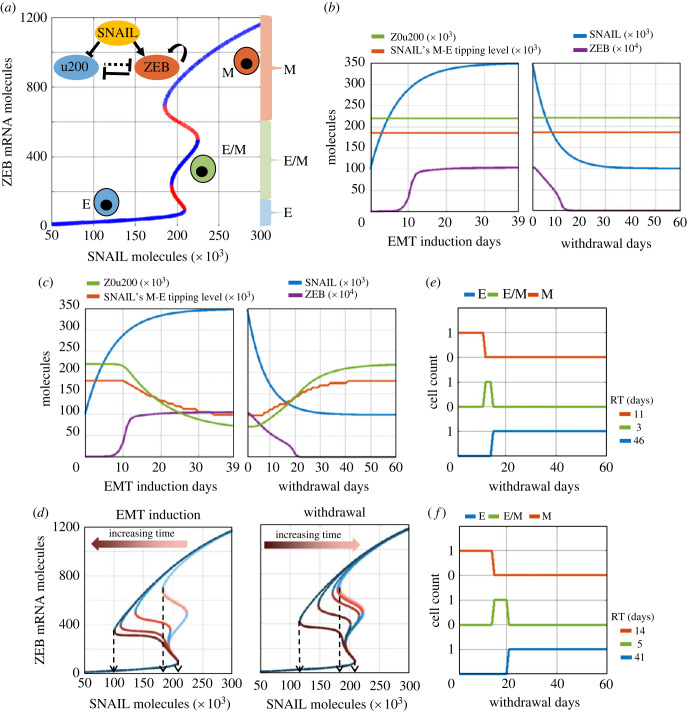
Figure 2.
A phenomenological mathematical model to capture epigenetic regulation during EMT. (a) (Inset) Regulatory network incorporating mutual inhibition between epithelial (mir200–u200) and mesenchymal (ZEB) players, with SNAIL as external input. Bifurcation diagram shows equilibrium levels of ZEB mRNA based on SNAIL levels, as resulting from dynamics of the regulatory network. Blue curves are stable equilibria while red ones are unstable. Three distinct coloured braces on the right (red, green and blue) qualitatively represents the ZEB mRNA levels used to assign epithelial (E), mesenchymal (M) or hybrid E/M phenotype. (b) Dynamics of ZEB levels with changing SNAIL levels during EMT induction (left) and withdrawal (right) without considering epigenetic regulation of miR-200 by ZEB. (c) The same as (b) but with incorporating epigenetic regulation. Z0u200 levels and SNAIL M-E tipping levels reflect the extent of epigenetic reprogramming at any time instant. (d) Bifurcation diagrams for ZEB mRNA levels for varying strengths of epigenetic regulation (Z0u200 levels) during EMT induction (left) or withdrawal (right) of EMT-inducing signal, at an interval of 10 days each (0, 10, 20, 30, 39 days post-induction, and 10, 20, 30, 40, 50, 60 days post-withdrawal). Black arrows highlight the SNAIL levels corresponding to E-to-M tipping (right arrow) and M-to-E tipping (left and middle arrows). (e) Changes in cell's phenotype during withdrawal period following EMT induction without epigenetic regulation. (f) Same as (e) but with the impact of epigenetic regulation. RT (residence time) measures the time that the cell spends in each phenotype during withdrawal period of 60 days. Parameters used in (b) and (e): S01 = 100k molecules, S02 = 350k molecules, α = 0, βfor = 1 h, and βrev = 1 h. When considering epigenetic regulation (panels c and f), α = 0.15, βfor = 240 h, and βrev = 240 h; all other parameters as above-mentioned.

