Figure 21.

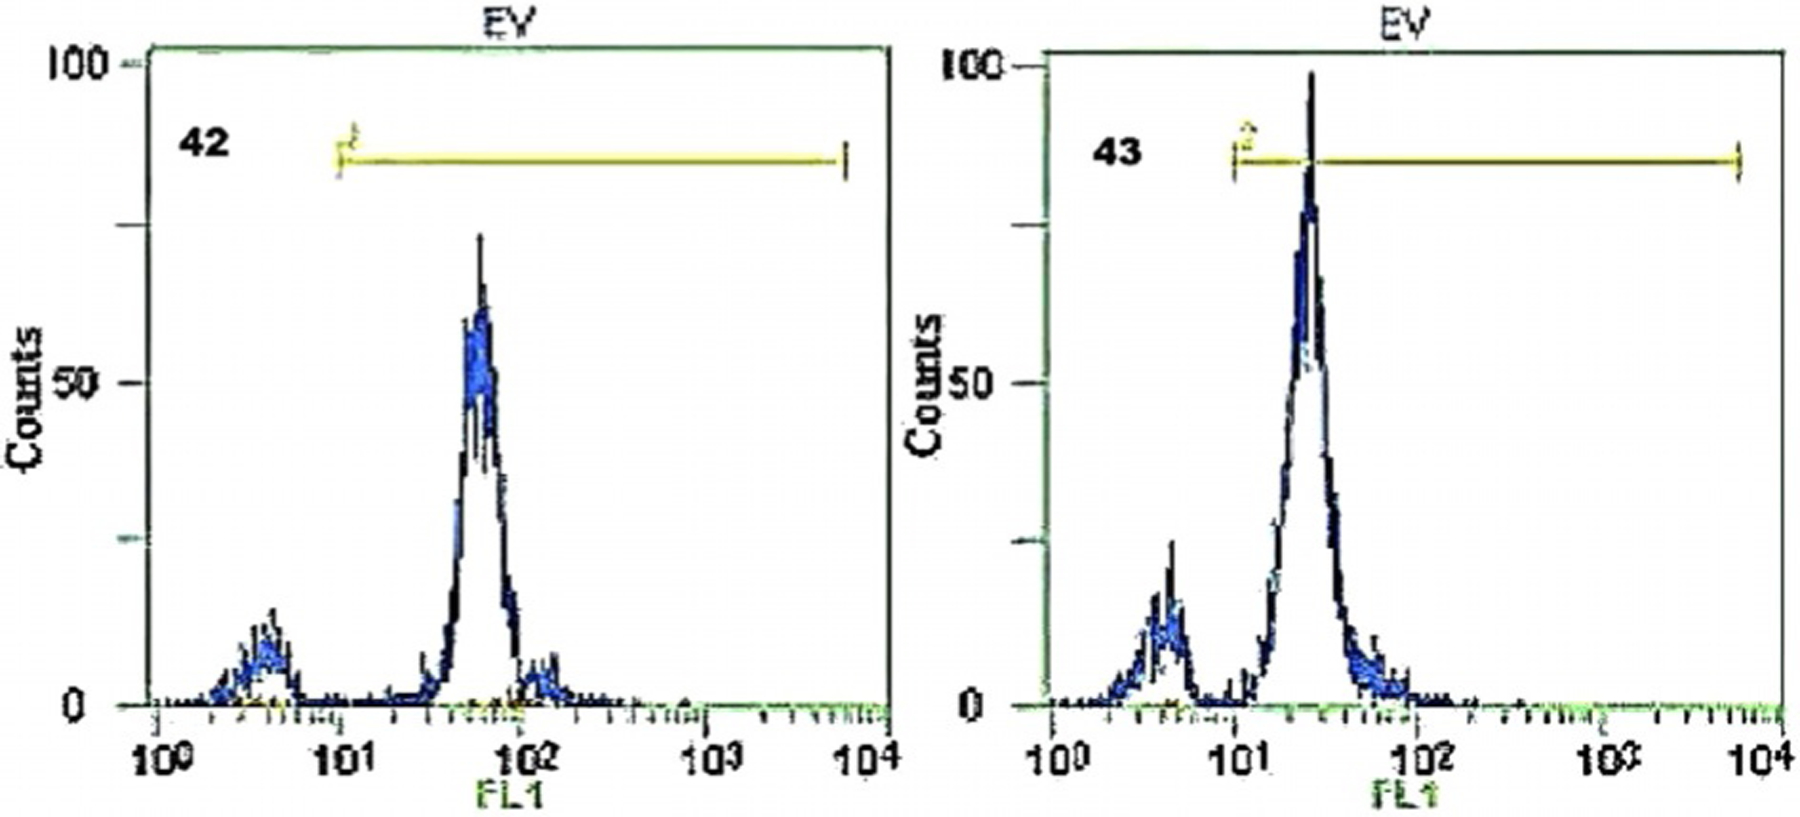
Flow cytometry histograms of dyes 42 and 43. The x-axis presents the fluorescence intensity of stained sperm cells, and the y-axis shows the number of the stained sperm cells.[58]

Flow cytometry histograms of dyes 42 and 43. The x-axis presents the fluorescence intensity of stained sperm cells, and the y-axis shows the number of the stained sperm cells.[58]