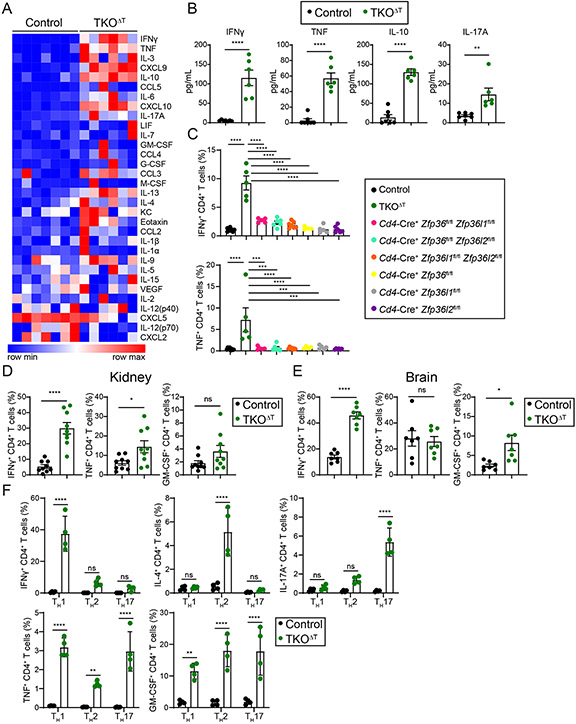
Figure 4: Hypercytokinemia in TKOΔT mice.
A, Heat map of serum cytokines and chemokines from Control and TKOΔT mice (n=6-7/group). B, Concentration of IFNγ, TNF, IL-10, and IL-17A in the sera of Control and TKOΔT mice (n=6-7/group). C, Quantitation of IFNγ+ and TNF+ CD4+ T cells from the indicated mice determined by ICS of bulk splenocytes cultured for 4 h with Brefeldin A (pooled from 4 experiments, n=5-8/group). D,E, Quantitation of IFNγ+, TNF+, and GM-CSF+ CD4+ T cells from the (D) kidney (pooled from 5 experiments, n=9/group) and (E) brain (pooled from 4 experiments, n=7/group) of Control and TKOΔT mice. F, CD4+ splenic T cells were polarized in different TH conditions. On day 4, cells were cultured for 4 h with Brefeldin A before ICS for IFNγ, IL-4, IL-17A, TNF, and GM-CSF (pooled from 2 experiments, n=4/group). Data in B-F are mean ± s.e.m. Unpaired two-sided Student’s t-test (B,D,E); one-way ANOVA with Tukey’s multiple comparisons test (C), two-way ANOVA with Šídák’s multiple comparisons test (F). *P < 0.05; **P < 0.01; ***P < 0.001; ****P < 0.001; ns, not significant.

