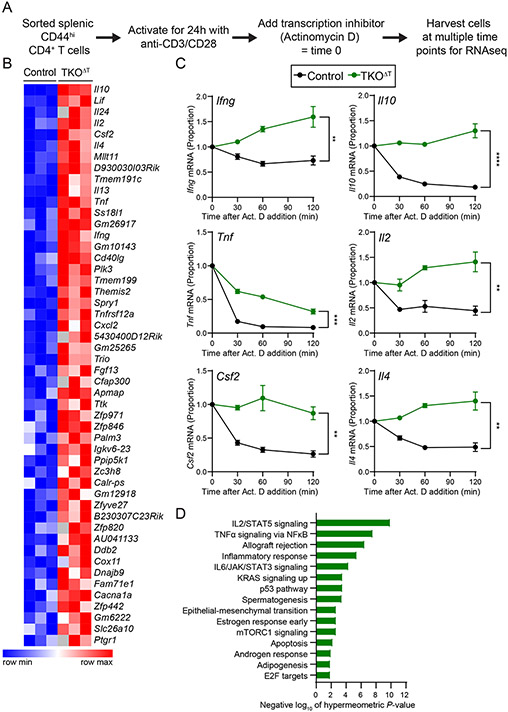
Figure 6: Increased cytokine gene transcript stability in TKOΔT CD4+ T cells.
A, Experimental schema. CD44hi CD4+ splenic T cells were sorted from Control and TKOΔT mice (n=3/group). Cells were then activated for 24 h on anti-CD3/CD28 coated cell culture plates at which point some cells were harvested (time 0) and some cells were treated with Actinomycin D (Act. D). At different times post-addition (30, 60, 120 min), cells were harvested for RNA-sequencing. B, Heat map representation of area under the curve (AUC) values for the top 50 most significant genes with increased AUC (P-value < 0.05) in TKOΔT CD4+ T cells compared to Control CD4+ T cells. C, mRNA decay curves for Ifng, Il10, Tnf, Il2, Csf2, and Il4. All time points are graphed as a fraction of the time 0 counts per million reads mapped. D, Enriched Hallmark pathways (FDR q-value < 0.05) in genes with increased AUC (P-value < 0.05) in TKOΔT CD4+ T cells compared to Control CD4+ T cells. Data in C are mean ± s.e.m. Unpaired two-sided Student’s t-test computed on the AUC. *P < 0.05; **P < 0.01; ***P < 0.001; ****P < 0.001; ns, not significant.

