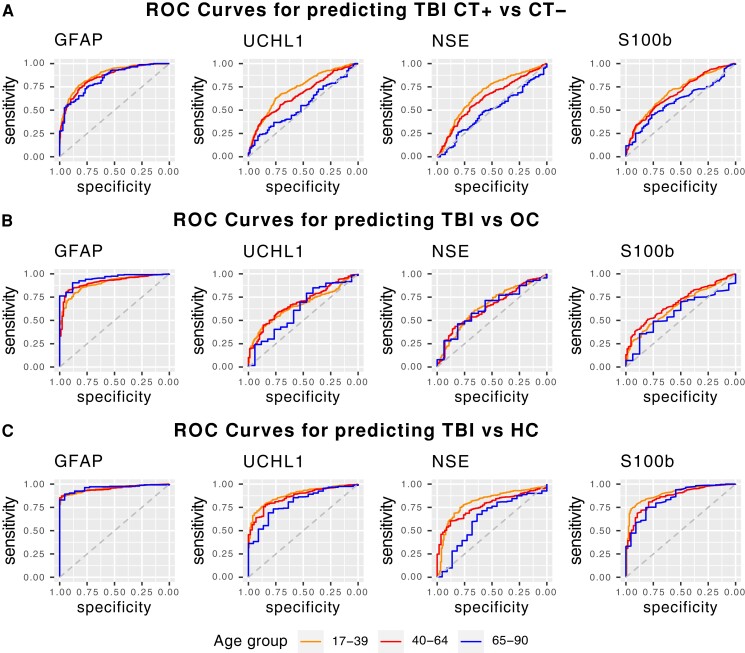
Figure 3.
ROC curves for Day 1 blood-based biomarkers for discrimination of CT+/CT−, TBI/OC, and TBI/HC Stratified by Age. Each plot shows age-stratified ROC curves of each Day 1 blood-based biomarker for discriminating TBI patients with a positive versus negative head CT (row A), for discriminating TBI patients from orthopedic controls (OC; row B), and for discriminating TBI patients from HCs (row C). ROC curves are colour coded as follows: age 17–39 years is shown in black; age 40–64 years, in red; age 65–90 years, in blue. Specific AUC values with 95% CIs are reported in Table 3.

