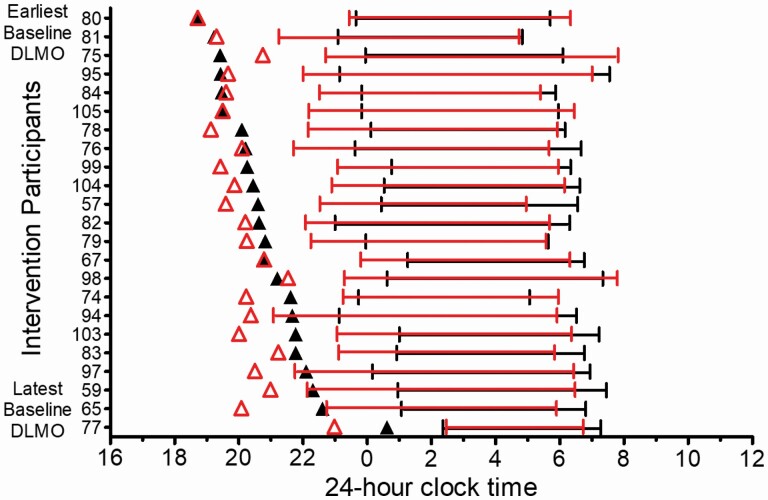
Figure 5.
DLMOs (black triangles = baseline DLMO; red triangles = final DLMO) and weekday sleep timing (bars = sleep onset to wake-up times measured from actigraphy on Sunday—Thursday nights) for the Intervention group. Baseline sleep = black bars; Experimental Week 2 sleep = red bars. Participants are arranged on the y-axis with the earliest baseline DLMO on the top and the latest baseline DLMO on the bottom.

