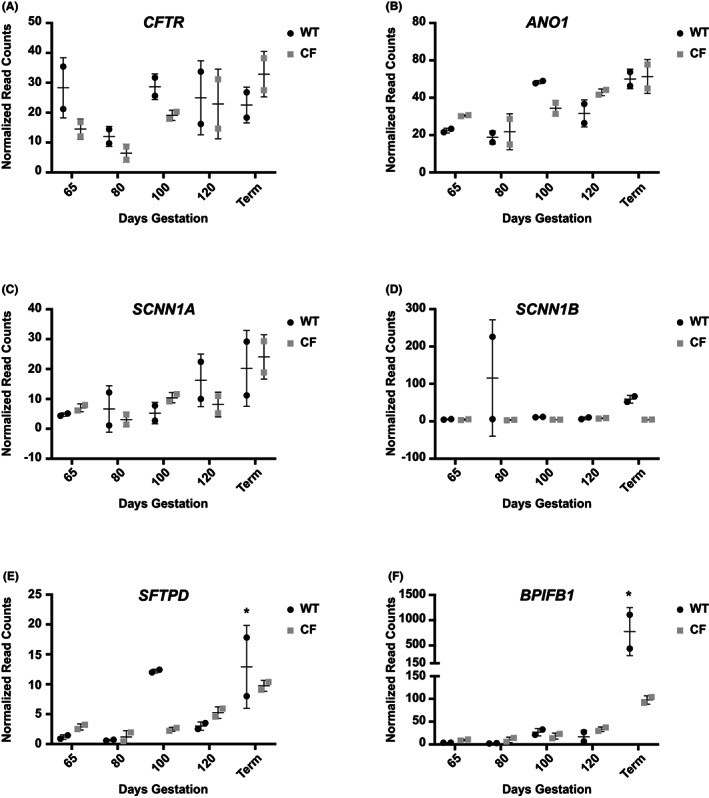
FIGURE 6.

Differential expression of key marker genes in WT and CFTR ‐/‐ fetal trachea through gestation. Data from RNA seq analysis of tracheal tissue samples at 65, 80, 100, 120 days gestation and term (147 days). (n = 2 at each time point). Individual graphs show normalized read counts for WT, black circles, and CF (CFTR ‐/‐), gray squares, of A) CFTR, B) ANO1, C) SCNN1A, D) SCNN1B, E) SFTPD, F) BPIFB1. * denotes term samples from ~6 h (low) and ~15 h (high) after birth.
