Figure 6.

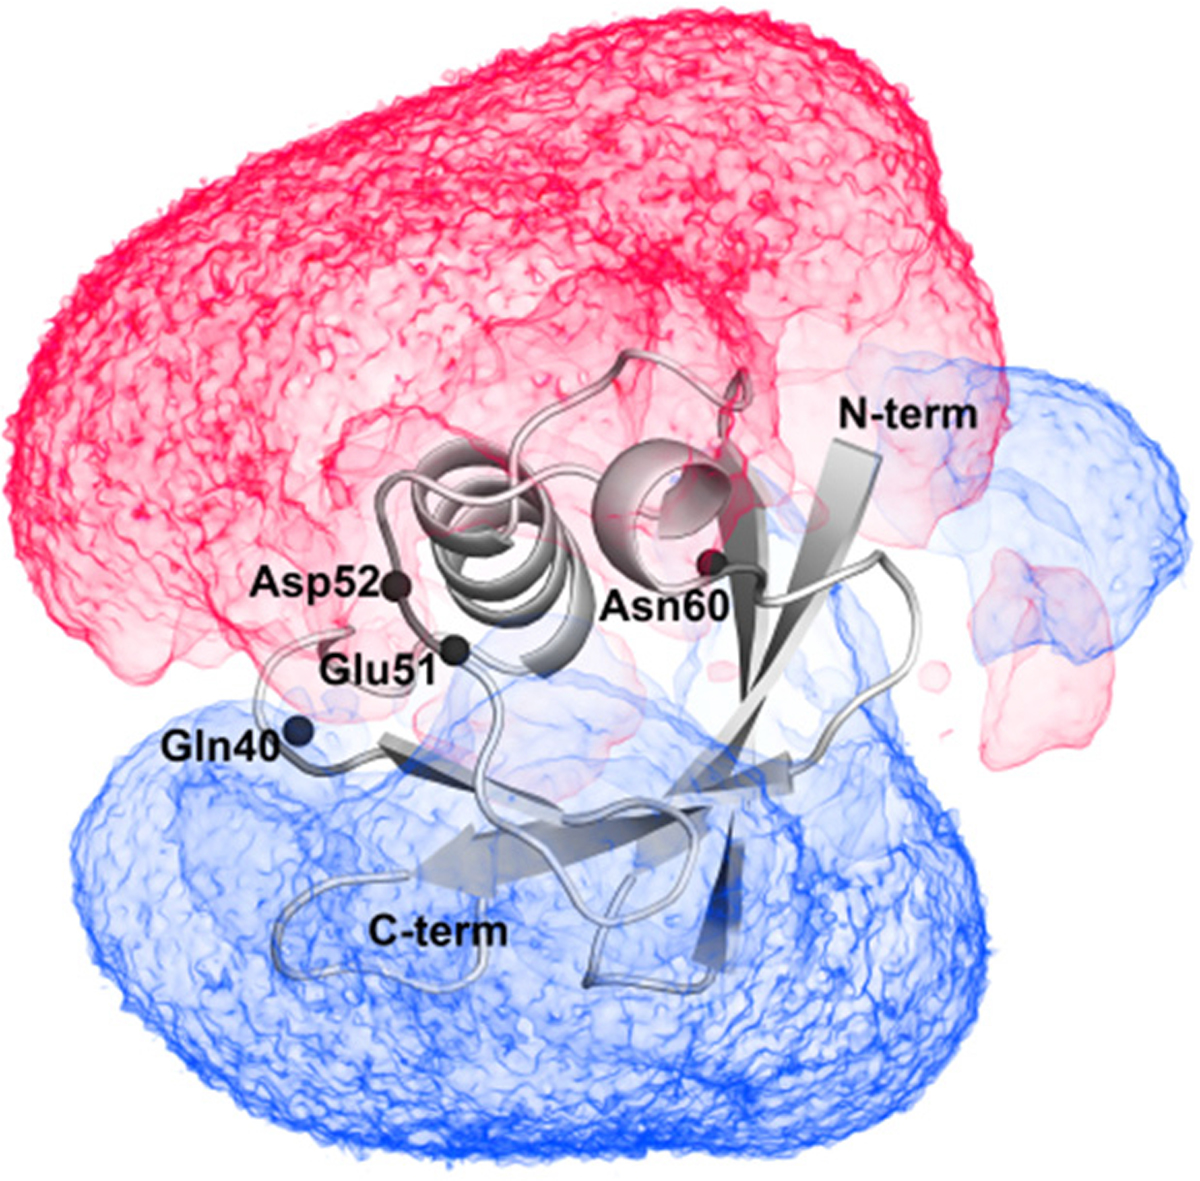
At 0 mM ionic strength, the volume map of electrostatic potentials in a range of −0.5 kBT/e (red color) and 0.5 kBT/e (blue color) around ubiquitin. Black spheres represent the backbone N atoms of labeled residues.

At 0 mM ionic strength, the volume map of electrostatic potentials in a range of −0.5 kBT/e (red color) and 0.5 kBT/e (blue color) around ubiquitin. Black spheres represent the backbone N atoms of labeled residues.