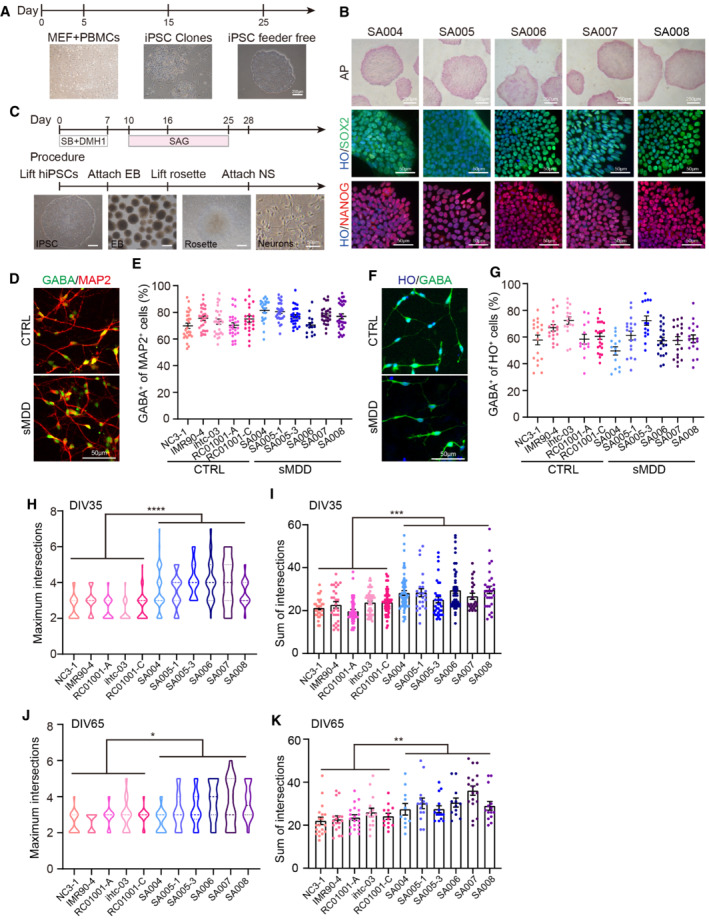
Figure EV1. Generation of iPSCs and GABA interneurons from sMDD patients. Related to Fig 1 .

- Scheme illustrating the generation of iPSCs from CTRL and sMDD patients' peripheral blood mononuclear cell (PBMC). Scale bar = 250 μm. (MEF, Mouse Embryonic Fibroblast).
- Alkaline phosphatase staining and SOX2, NANOG immunostaining in undifferentiated iPSCs from 5 sMDD patients. Scale bar shown in the images.
- Schematic diagram of iPSC differentiation to GINs. The left three pannels: scale bar = 250 μm. The right pannel: scale bar = 50 μm.
- Representative images of GABAergic interneurons with the staining of GABA and MAP2 from CTRL and sMDD groups. Scale bar = 50 μm.
- The proportion of GABA+ cells of MAP2+ neurons from five CTRL cell lines and six sMDD cell lines at day 35. n ≥ 15. Mean ratio ± SEM.
- Representative images of GABAergic interneurons with the staining of HO and GABA from CTRL and sMDD cell lines. Scale bar = 50 μm.
- The proportion of GABA+ neurons of HO+ cells from five CTRL cell lines and six sMDD cell lines at day 35. n ≥ 13.Mean ratio ± SEM.
- Quantification of maximum of intersections shown in five CTRL cell lines and six sMDD cell lines at day 35, n = 226 neurons from CTRL groups, n = 260 neurons from sMDD groups. Nested t‐test, ****P < 0.0001 for CTRL versus sMDD. The center line represents the median. Mean ratio ± SEM.
- Quantification of sum of intersections shown in five CTRL cell lines and six sMDD cell lines at day 35, n = 226 neurons from CTRL groups, n = 260 neurons from sMDD groups. Nested t‐test, ***P = 0.0006 for CTRL versus sMDD. Mean ratio ± SEM.
- Quantification of maximum of intersections by Sholl analysis shown in five CTRL cell lines and six sMDD cell lines at day 65, n = 83 neurons from both CTRL groups and sMDD groups. Nested t‐test, *P = 0.0118 for CTRL versus sMDD. The center line represents the median. Mean ratio ± SEM.
- Quantification of sum of intersections by Sholl analysis shown in five CTRL cell lines and six sMDD cell lines at day 65, n = 83 neurons from both CTRL groups and sMDD groups. Nested t‐test, **P = 0.0027 for CTRL versus sMDD. Mean ratio ± SEM.
Source data are available online for this figure.
