
Figure 3. Defects in calcium signaling both in sMDD GINs and ventral forebrain organoids.
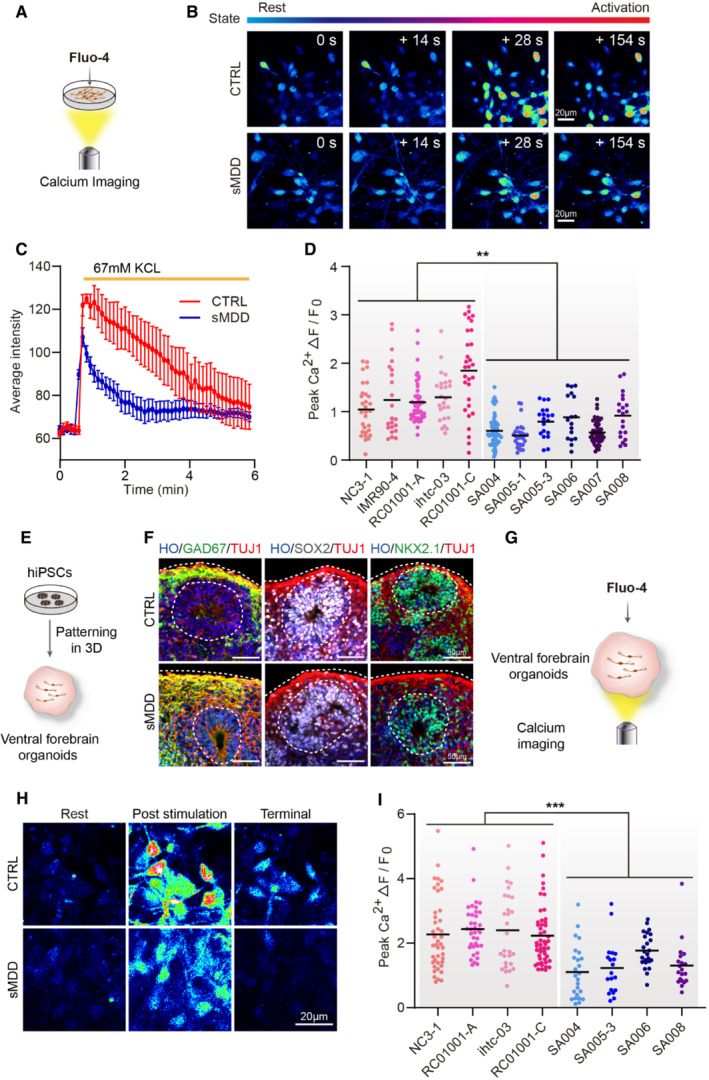
- Schematic diagram of calcium imaging for neurons with Fluo‐4 indicator dyes.
- Representative images of calcium imaging in CTRL and sMDD GINs at each timepoint. Scale bar = 20 μm.
- The representative trajectory of average intensity changes over time from CTRL (red line) and sMDD (blue line) neurons in response to 67 mM KCL. CTRL, n = 6 neurons; sMDD, n = 6 neurons. Traces are from a representative experiment (the whole quantification result is shown in D). Mean ratio ± SEM.
- Quantification of peak [Ca2+] (F max–F 0)/F 0 shown per cell line (n = 155 neurons derived from five CTRL cell lines, n = 198 neurons derived from six sMDD cell lines). Nested t‐test, **P = 0.0022 for CTRL versus sMDD. Mean ratio ± SEM.
- Schematic illustrating the generation of human ventral forebrain organoids from hiPS cells.
- Immunostaining for the GABA interneuron marker GAD67, neural progenitor marker SOX2 and ventral prosencephalic progenitor marker NKX2.1 at day 30 in CTRL and sMDD ventral forebrain organoids. Scale bar = 50 μm.
- Schematic diagram of calcium imaging for ventral forebrain organoids with Fluo‐4 indicator dyes.
- Representative images of calcium imaging in CTRL and sMDD ventral forebrain organoids at different states. Scale bar = 20 μm.
- Quantification of peak [Ca2+] (F max–F 0)/F 0 shown per cell line (n = 156 neurons derived from four CTRL cell lines, n = 88 neurons derived from four sMDD cell lines). Nested t‐test, ***P = 0.0005 for CTRL versus sMDD. Mean ratio ± SEM.
Source data are available online for this figure.