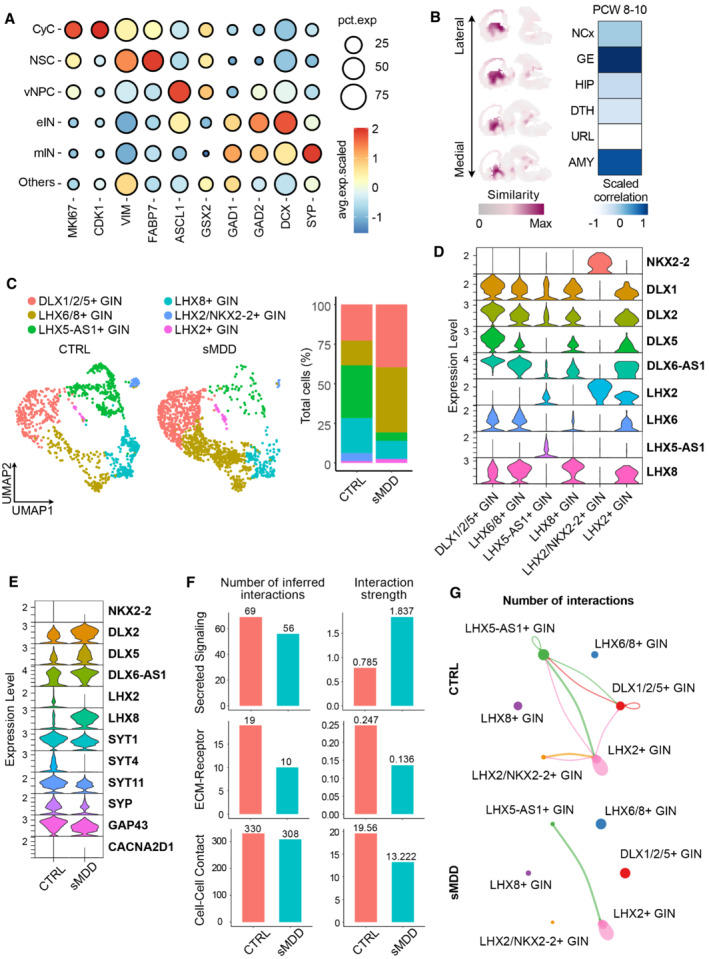
Dot plot showing the expression level and percentage of representative marker genes across the six main cell types. The mRNA level of each gene is shown on the linear scale and normalized for different groups.
VoxHunt spatial mapping of our single cell transcriptome onto data from E13.5 mouse brains, which is available in the Allen Brain database. Sagittal sections are shown and colored by scaled similarity scores.
Left panel: UMAP visualization of GABAergic neuron subclusters, split by groups. Right panel: Stacked bar chart showing the composition of different GINs for each sample, after 35 days of differentiation.
Stacked violin plot showing the expression level of ventral transcription factors across different types of GINs.
Stacked violin plot showing the genes differentially expressed in CTRL and sMDD GINs.
Bar plots showing the number of inferred interactions and interaction strength for ligand‐receptor pairs in CTRL and sMDD GINs, which could be classified into three categories, including Secreted Signaling, ECM‐Receptor, and Cell–Cell Contact.
Cell communication networks showing the number of interactions related to ECM‐receptor in CTRL and sMDD GIN subclusters.

