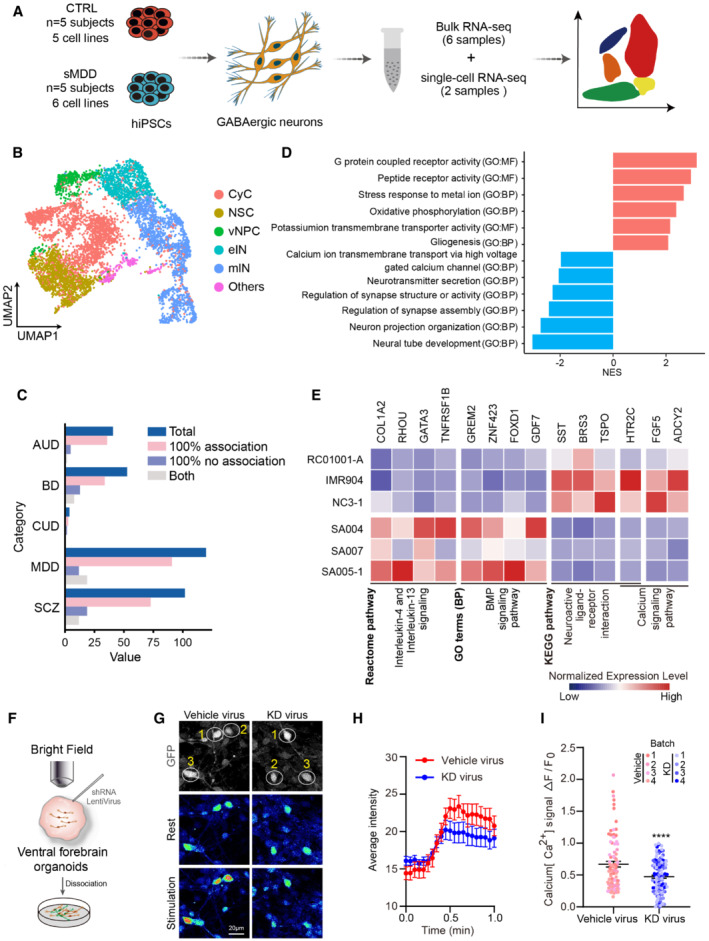
Figure 4. Analysis of scRNA‐seq and bulk RNA‐seq identified abnormal expression of HTR2C .

- Schematic representation of transcriptomic sequencing experiments for GABAergic neurons derived from CTRL and sMDD iPSCs.
- UMAP plot showing the cell types detected in CTRL and sMDD samples. CyC, cycling cells; NSC, neuronal stem cells; vNPC, ventral neuronal progenitor cells; eIN, early interneurons; mIN, mature interneurons.
- Bar plot showing the number of genes associated with known mental illnesses, based on PsyGeNET. “Total” presents all of the genes related to a given disease. “100% association” presents the genes only positively correlated with the disease. “100% no association” presents the genes only negatively correlated with the disease. “Both” means genes that both positive and negative results were found. AUD, BD, CUD, MDD, and SCZ represent alcohol use disorder, bipolar disorder, cocaine use disorder, major depressive disorder, and schizophrenia, respectively.
- Gene set enrichment analysis (GSEA) for GIN clusters, which was based on Ontology gene sets of differentially expressed genes (DEGs). Presented GO terms are all significantly changed (adjusted P‐value < 0.05).
- Heatmap illustrating the expression level of DEGs enriched in selected Reactome pathways, gene ontology (GO) terms, and Kyoto Encyclopedia of Genes and Genomes (KEGG) pathways, which is normalized by row.
- Schematic diagram of injecting knockdown virus into ventral forebrain organoids followed by neurons adherent.
- Calcium imaging was performed on GFP+ neurons in the knockdown group. The representative image shows the rest state of GFP+ cells and the state of cells after KCl stimulation. The pseudo‐color showed Rhod‐4 calcium fluorescent dye, and the selected cells are GFP+ neurons. Scale bar = 20 μm.
- The representative trajectory of average intensity changes over time in Vehicle virus and KD virus groups. CTRL, n = 10 neurons; sMDD, n = 10 neurons. Traces are from a representative experiment (the whole quantification result is shown in I). Mean ratio ± SEM.
- Quantification of peak [Ca2+] (F max–F 0)/F 0 shown per virus group. n = 89 for Vehicle virus, n = 118 for KD virus, respectively from four batches. T‐test, ****P < 0.0001. Mean ratio ± SEM.
Source data are available online for this figure.
